Consumer spending holds up well in August, despite ending of disinflation
Consumer spending holds up well in August, despite ending of disinflation
– by New Deal democrat
As I have repeated for the past several months, in the current economy the personal spending and income report is just as important as the jobs report. That’s because, despite the downturn in manufacturing production and many parts of the housing market, consumer spending especially on services has continued to power the economy forward.
Today’s report generally showed a continuation of this slow but steady improvement in almost all of the metrics since June 2022, when gas prices peaked at $5.
Real personal spending rose 0.1%, while real personal income rounded to unchanged in August, as shown in the below graph in which both real personal income (red) and spending (blue) are normed to 100 as of the onset of the pandemic:

The NBER has indicated they place great weight on both of these, and neither are consistent with the onset of recession.
Another of the important coincident measures for the NBER, real personal income less government transfer receipts, also rose a slight 0.1%, and is up 1.7% from a year ago:

This series has risen pretty consistently since the peak of gas prices at $5 in June 2022.
On the spending side, here’s how goods vs. services spending compare. I show this because real spending on goods has in the past declined months in advance of recessions, while real spending on services has frequently powered right through. Both of these also increased in August, another positive sign:

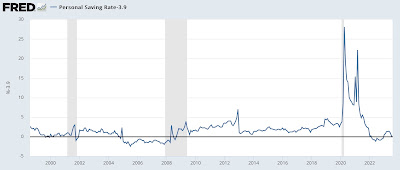
Meanwhile, the personal saving rate – income that isn’t spent – declined further to 3.9%:

There were extensive historical revisions to this series published yesterday. Last month was initially reported at 3.5%, but as you can see that has been revised away. Last month Inwrote that “With the exception of several months last year, and the 2005-07 lows, the personal saving rate is at its lowest level ever.” This has also mainly been revised away. The net effect is that consumers are less vulnerable to shocks than it previously appeared. Further, the savings rate typically rises before recessions, as consumers get more cautious. Needless to say, that isn’t happening now.
The one negative in today’s report was that the deceleration in the personal consumption deflator, which started with the peak in gas and commodity prices generally in June 2022, has likely ended. The PCE deflator, the chain type measure of inflation in this report, rose 0.4% in August, the highest monthly change since January. On a YoY basis, prices are up 3.5%. This was the second increase in a row:

Finally, the personal consumption deflator gets used in the calculation of real manufacturing and trade sales, which is another important coincident indicator monitored by the NBER. These rose a sharp 0.8% in August to within 1% of their December2021 record, and are well above their June 2022 low:

Two months ago I summed up by writing about this report with “If that tailwind [of YoY decelerating prices] is ending – and I suspect it is – what happens next?” So far, sales and spending are certainly holding up. The next big clue will be whether the deceleration in hiring continues in next Friday’s jobs report.
Driven by the hurricane force disinflationary tailwind, real personal spending and income, and real sales, all increase nicely, Angry Bear, New Deal democrat

An October 2023 Global Equity Crash.
No one on Angry Bear has posted since the CR has been passed. Bipartisan pragmatism over idiotic narrow (Maggot) extremism still prevails in the US democratic experiment.
Two solid US republican citizen representatives (no sarcasm intended on the House Ways and Means committee)( a 60 minute view) presented a Ron Paul-like sobering mathematical argument against the sustainability of America’s spending, obligations, verses its tax revenue numbers with he social security trust fund going bust in 2033. What they said within the context of a family or a business’s budget analogy was true, but isn’t the real state of asset-debt macroeconomic affairs.
https://www.youtube.com/watch?v=sRi9rEpc4JI
The bottom line in the big picture of the 1807 36/90/90/54 year :: x/2.5x/2.5x/1.5x (November 8/2021 current Wilshire inflation adjusted valuation high) US hegemonic Lammert (longwave) Great Fractal Series is that the US Federal Reserve {backed by the hopefully reliable US nuclear deliverable arsenal} is like a Parker Brother’s friendly Monopoly game personal banker. When a player loses the game and goes bankrupt, the friendly personal banker in this sovereign Monopoly game can magically extend a loan (from its own persona) to the loser player to continue playing …
This has already happened in Japan with a debt to GDP ratio of 240% with an annual tax-dependent federal spending to debt ratio is about 20 % (like the Us’s ratio). The Bank of Japan (Fed equivalent), holds most of Japan’s debt.
This happens more easily with near zero to negative interest rates on sovereign debt as has happened during recessions since 2009. More recessions can be expected. (but not as severe as 1929 when the symbiotic government-central bank printing press was not as well oiled).