June housing report: a tale a two diametrically opposed sectors
June housing report: a tale a two diametrically opposed sectors
– by New Deal democrat
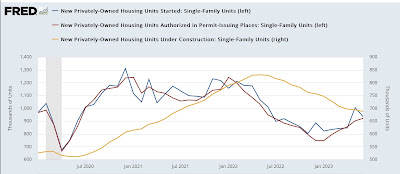
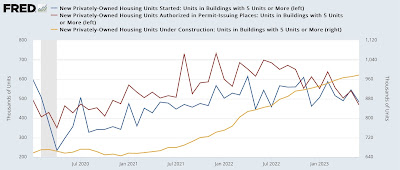
Yesterday I wrote that housing under construction, along with new vehicle sales, were two important reasons that no economic downturn had occurred yet. Today’s report on housing construction for June showed two almost diametrically opposed trends: single family houses had a sharp increase in permits and starts, while units under construction made a 12 month low. Conversely, multi-family dwellings had sharp declines in permits and starts, while units under construction were at multi-decade highs.
So let’s break this month’s report down into those two categories: single-family vs. multi-family dwellings.
Permits (red in the graph below) are the most leading of the metrics, and single family permits have the least noise and most signal of any metric. These increased 20,000 annualized to a new 12 month high. Starts (blue) declined -70,000 annualized, but were nevertheless close to the 12 month high set last month. But units under construction (gold, right scale) declined -6,000 to a new 12 month low:

The story was completely reversed for multi-family dwellings. Permits (red) declined -73,000 to a new 12 month low, and starts (blue) declined -63,000 to the 3rd lowest level in 12 months. But units under construction (gold, right scale) increased 7,000 to not just a 12 month, but another all-time high:

It’s easy to see in the above how the data progresses from permits to starts to units under construction. Since mortgage rates lead permits, below are mortgage rates averaged monthly (inverted) vs. single family permits (red, right scale):

You can see that last year’s big increase in mortgage rates led to a big decrease in permits. The decline in mortgage rates earlier this year has led to an interim increase in permits. I suspect permits will decline slightly again as the recent increase in rates back to 7% filters through the system.
But the actual economic impact is via units under construction. Below I show total units under construction (blue, right scale)), as well as the single-family (red) and multi-family (gold) units components:

In total, units under construction have fallen slightly from their peak (meaning a very minor effect on the economy), while single-family units have declilned at a recessionary pace. But that has been almost totally offset by the record increase in multi-family units under construction. Undoubtedly the dominant reason for that is the big surge in housing prices after the pandemic, which priced single family dwellings out of the price range of many younger potential buyers. Since multi-unit apartments and condos tend to be less expensive, and thus somewhat of a replacement good, this is where the growth has been.
For forecasting purposes, most importantly, in the booming multi-family sector, permits have fallen to their lowest level since October 2020. Starts are close to their lowest level since the end of 2021. Units under construction have not peaked yet, and are probably several months away from peaking. The exact reverse is true about single family units. Since multi-unit construction is over 60% of total activity, and more importantly because there is a much greater downside to multi-family construction if they follow permits, vs. limited upside for single family units, I anticipate downward pressure on the economy overall as a result.
US recession fears ease: surprisingly strong data on housing, consumer confidence, labor market, Angry Bear, New Deal democrat
