Healthcare Insurance Benefits In 2024: Higher Premiums Persist
This is just a partial of a much longer commentary by Health Affairs on Employer healthcare insurance for single employees am employees with families. “Health Benefits In 2024: Higher Premiums Persist, Employer Strategies for GLP-1 Coverage and Family-Building Benefits,” Health Affairs.
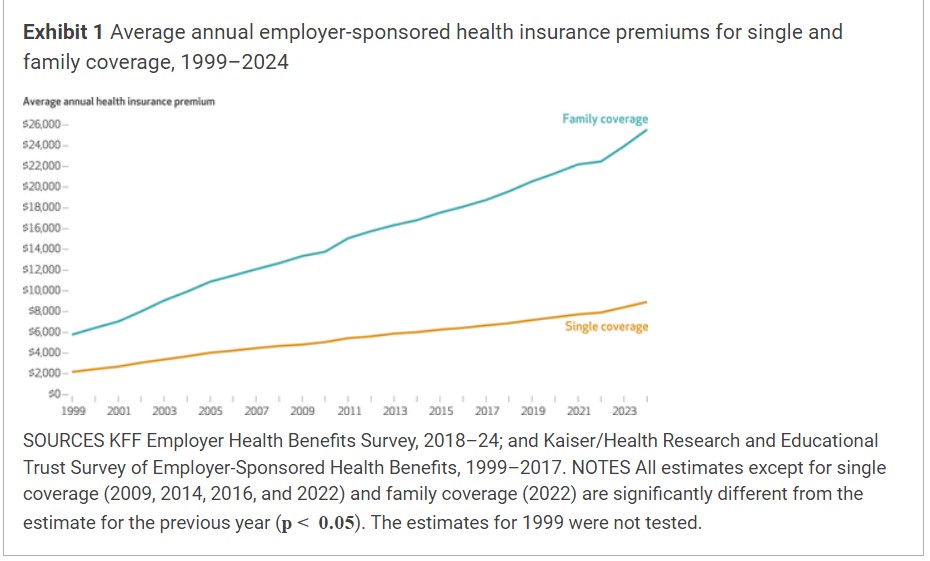
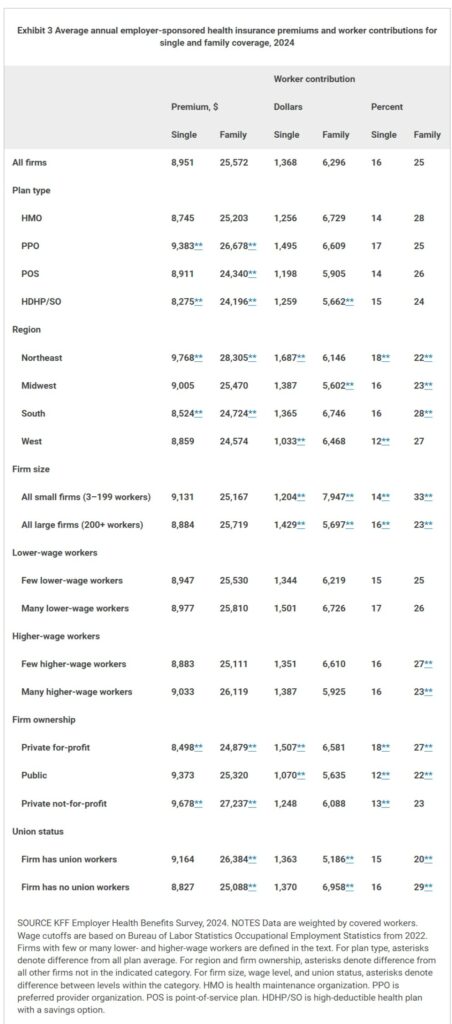
I have used two of the charts to emphasis what is occurring. The first chart will show the variance between single and family coverage 1999-1924. The second chart (click on it to enlarge) will show employee contribution for single and family coverage. It also covers the various types of healthcare (PPO, HMO, etc.). It is also broken out by regions, types of employees, private or public firms, union, higher or lower wage employees, etc.
Hence why I used these two charts. Both are revealing and tell us things are not getting much better for healthcare insurance costs. With government intervention? The same old, same old. No from Republicans and yes from Democrats. Read on . . .
The average annual premium for workers covered by their own firm in 2024 was $8,951 for single coverage and $25,572 for family coverage (exhibit 1). These averages were, respectively, 6 percent and 7 percent higher than in 2023. For comparison, the inflation rate over the course of the past year was 3.2 percent, and wage growth was 4.5 percent.4,5
During the past five years, the average premium for family coverage has risen from $20,576 to $25,572, an increase of 24 percent. During the same period, the inflation rate was 23 percent, and wages grew 28 percent (data not shown). This was the second consecutive year of 7 percent growth, resulting in 14 percent growth over the course of the past two years compared with 5 percent between 2020 and 2022 (data not shown).
Average single and family premiums were higher for covered workers in PPO plans and lower for covered workers in HDHP/SO plans compared with all firms. Average premiums for single and family coverage were lower for workers at for-profit private employers and higher for workers at not-for-profit private employers (exhibit 3).
Covered workers, on average, contributed 16 percent of the premium for single coverage and 25 percent of the premium for family coverage in 2024 (exhibit 3). There was, however, significant variation around these averages. Thirty-seven percent of covered workers at small firms were enrolled in plans with no premium contribution for single coverage, compared with only 5 percent of covered workers at large firms. In contrast, 26 percent of covered workers at small firms were enrolled in plans with a worker contribution of 50 percent or more for family coverage, compared with only 6 percent at large firms (data not shown). Overall, covered workers in small firms faced a higher average contribution rate for family coverage than covered workers in large firms (33 percent versus 23 percent) (exhibit 3).
The average amount that covered workers contributed toward their premiums was $1,368 for single coverage and $6,296 for family coverage, similar to in 2023. The average contribution amount for family coverage was higher for covered workers in small firms ($7,947) compared with those in large firms ($5,697), whereas the average contribution amount for single coverage was lower for covered workers in small firms ($1,204) than those in large firms ($1,429) (exhibit 3). Thirty percent of covered workers in small firms offering family coverage were in a plan with a premium contribution of more than $10,000, compared with 8 percent of covered workers in large firms offering family coverage (data not shown).
4. Bureau of Labor Statistics. Consumer Price Index, U.S. city average of annual inflation, 2014–2024 [Internet]. Washington (DC): BLS; [cited 2024 Sept 30]. Available from: https://data.bls.gov/timeseries/CUUR0000SA0 Google Scholar
5. Average hourly earnings of production and nonsupervisory employees (seasonally adjusted) from the Current Employment Statistics survey. See Bureau of Labor Statistics. Employment, hours, and earnings from the Current Employment Statistics survey (national), 2014–2024 [Internet]. Washington (DC): BLS; [cited 2024 Sept 30]. Available from: https://data.bls.gov/timeseries/CES0500000008 Google Scholar


