US Population Growth
In 2006, Joel Garreau (Smithsonian) wrote:
“The United States’ population is growing at the rate of almost 1 percent per year, thanks in part to immigration and its secondary effects. Not only does the United States accept more legal immigrants as permanent residents than the rest of the world combined, but these recent arrivals tend to have more children than established residents—until, as their descendants attain affluence and education, the birthrates of these Americans also drop below replacement levels. Overall—that is, counting both immigrants and the native-born—the United States has a replacement rate of 2.03 in 2006.”
From the year 2006 onward, replacement has been decreasing. Statistical Replacement Rate in 2020 fell to 1,637.5 births per 1,000 women and down from 1.7 births per 1,000 women in 2019 (Angry Bear).
If my math is correct, replacement rate in 2022 fell slightly to 1.665 and 1.620 in 2023. In other words, we will see a decreasing population which is not necessarily good for economic reasons (The birthrate [below] at 1,101 is solely birth rate which would not include immigration). With immigration I suspect it should be 1,701 to be even close to other numbers cited. I can not find the Census version of this numeric tor 2024. It still does not change the dynamic. The US is not replacing its population with younger workers either by birth or immigration. Baby boomers are checking out of the work force and life for that matter. We are not replacing ourselves with enough birth or immigration.
The US may begin to experience the same as many European countries having been. An aging work force. If you notice Joel Garreau (above) discusses a replacement rate which includes immigration to reach 2.03. The link to his commentary is there. This is part 1 or two parts. The next part will talk about immigration. Part 1 is now.
~~~~~~~~
2024 Current State of the Union: US Population, usafacts.org
How is the population changing and growing? . . . A summation.
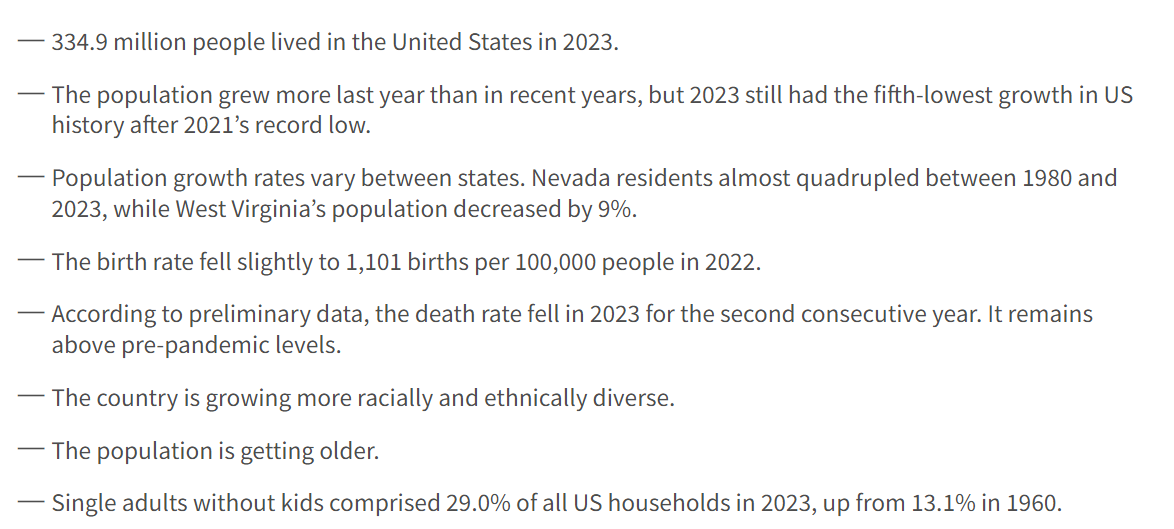
334.9 million people lived in the United States in 2023.
That’s a 47.4% increase since 1980.
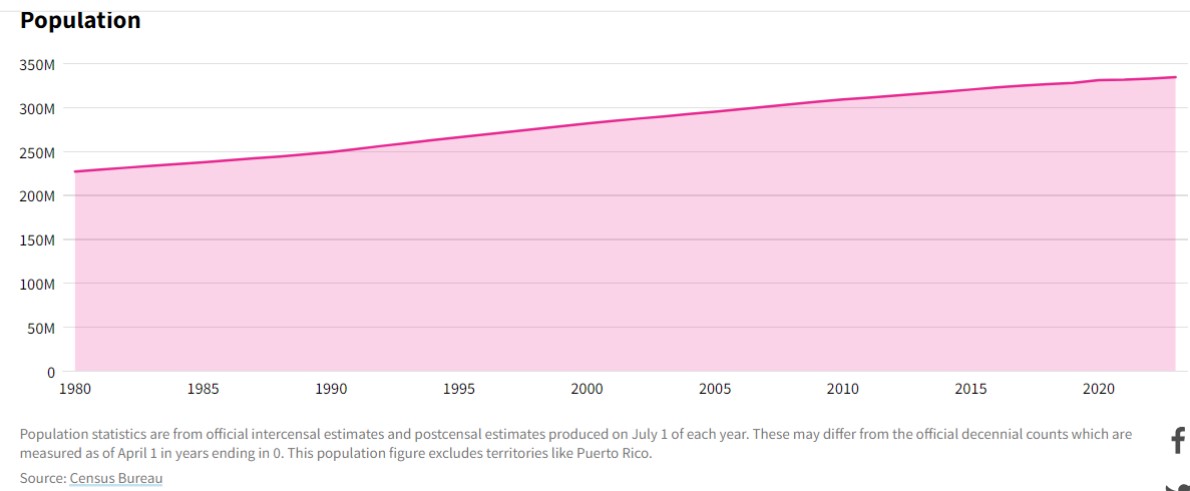
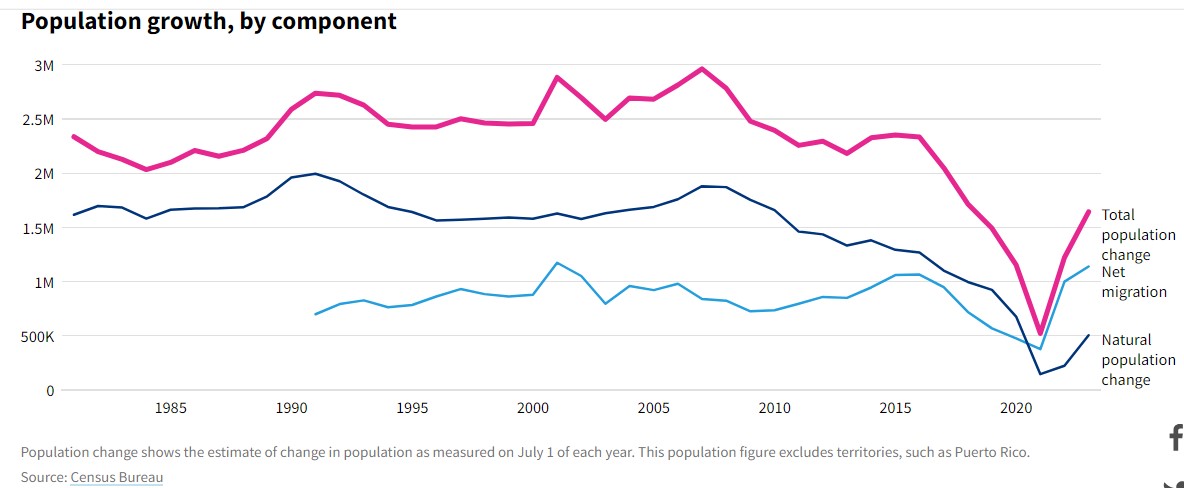
The population grew more last year than in recent years, but 2023 still had the fifth-lowest growth in US history after 2021’s record low.
Births, deaths, and net migration (the net effect of people moving into and out of the country) caused the population to grow by 1.6 million last year, or 0.5%.
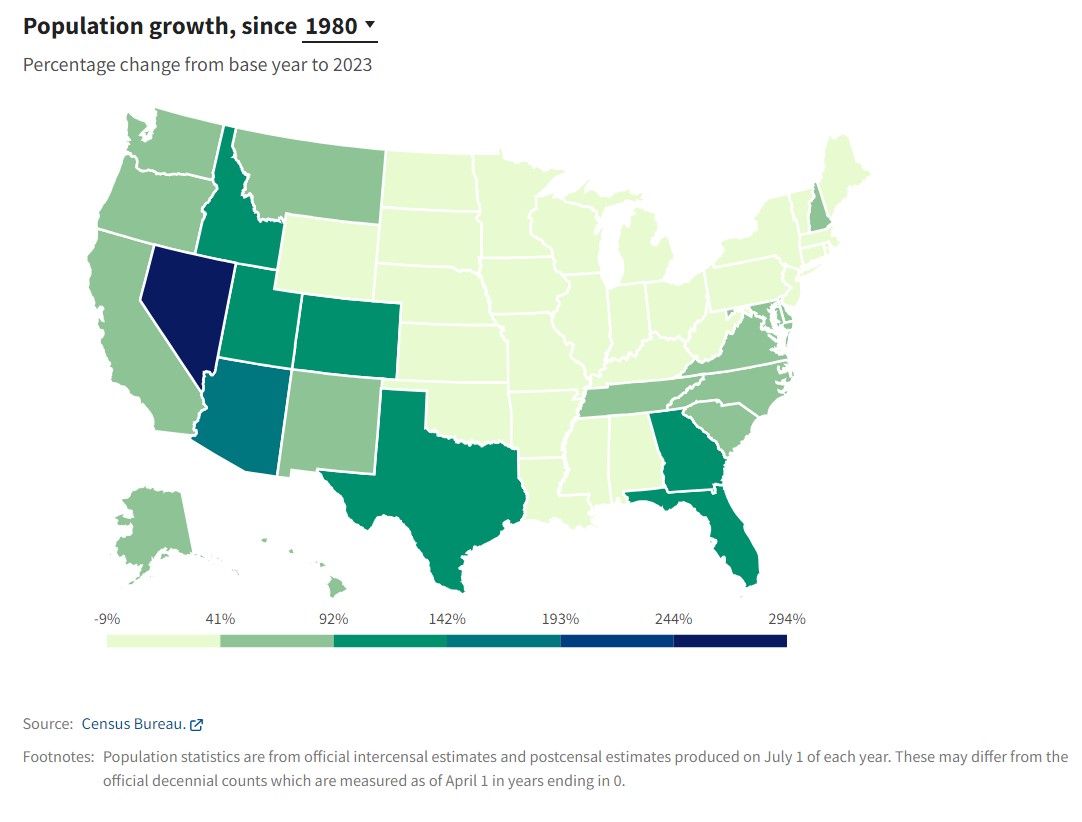
Population growth rates vary between states. Nevada residents almost quadrupled between 1980 and 2023, while West Virginia’s population decreased by 9%.
The population also more than doubled in Arizona, Utah, Florida, Texas, Idaho, Colorado, and Georgia.
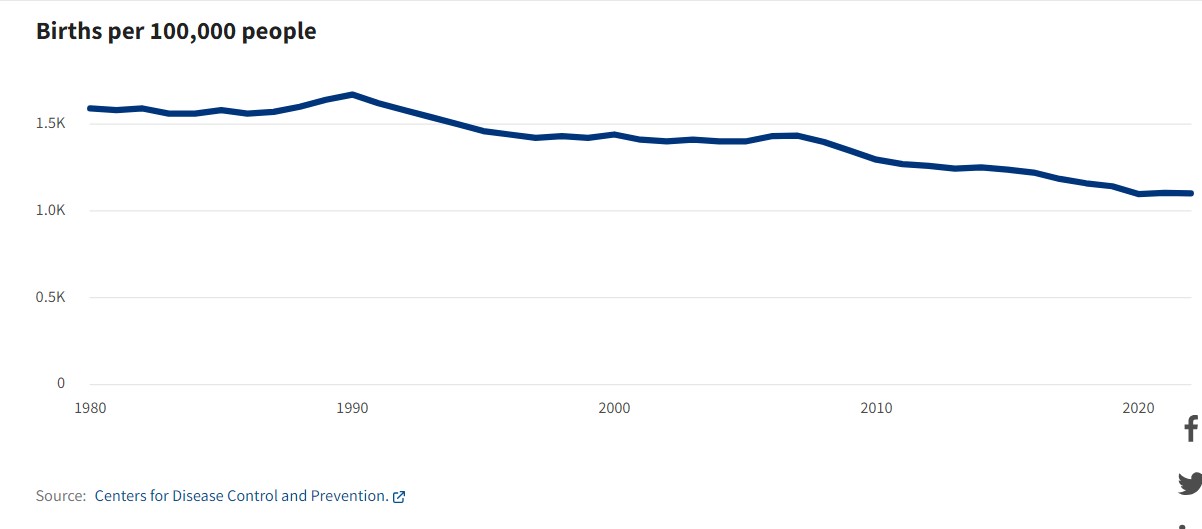
The birth rate fell slightly to 1,101 births per 100,000 people in 2022.
This is the second lowest rate since the beginning of available data and near the record low of 1,097 births per 100,000 reached in 2020.
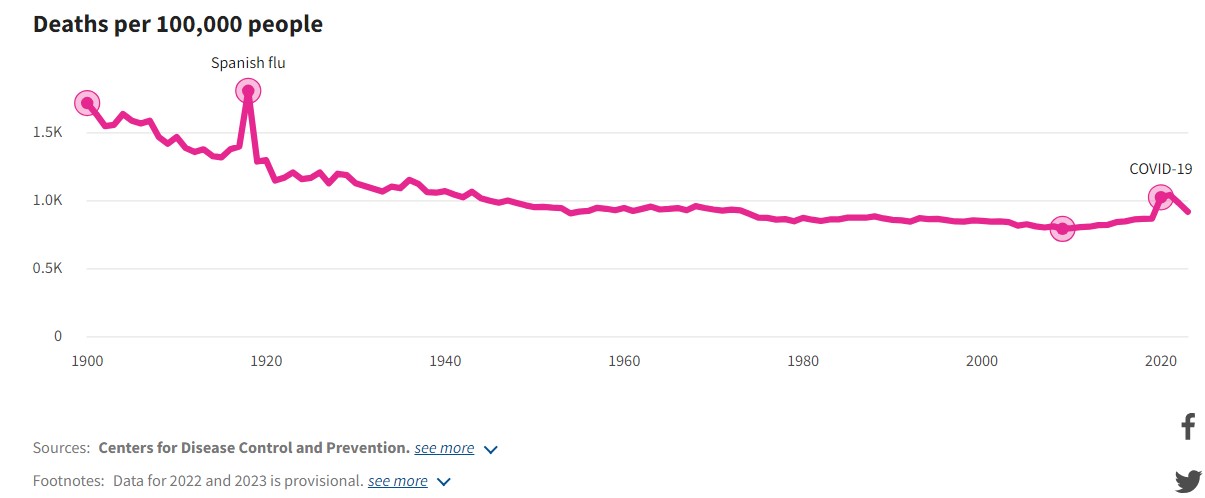
According to preliminary data, the death rate fell in 2023 for the second consecutive year. It remains above pre-pandemic levels.
2023’s death rate of 919.8 deaths per 100,000 people exceeded that of any year from 1974 to 2019.
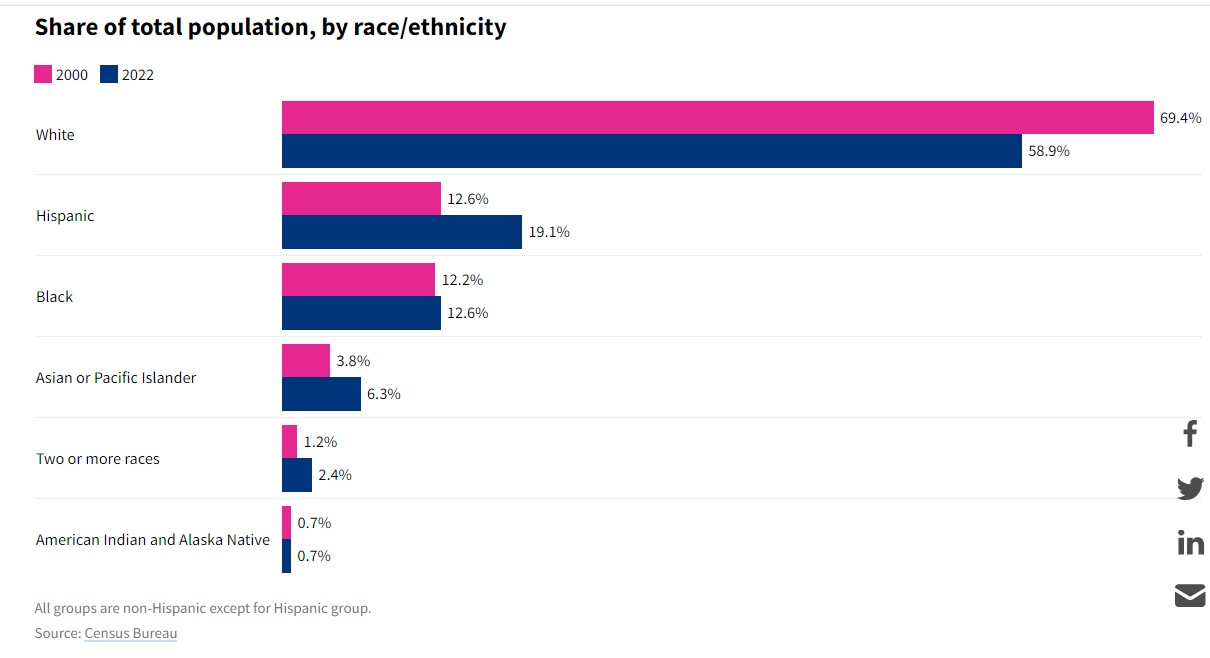
The country is growing more racially and ethnically diverse.
From 2000 to 2022, the Hispanic share of the US population grew faster than any other, rising from 12.6% to 19.1%.
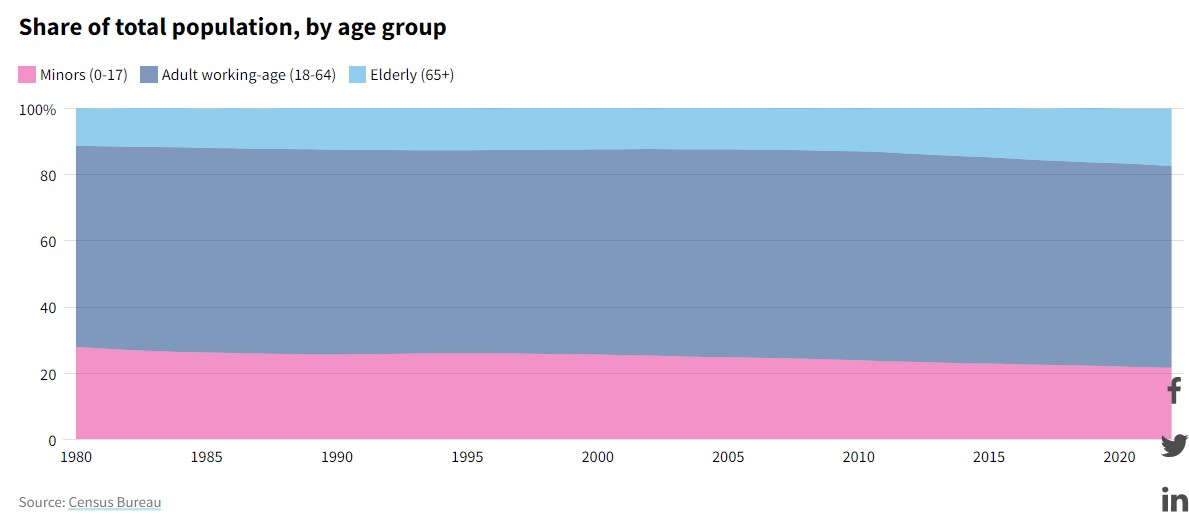
The population is getting older.
The proportion of working-age adults in the US remained relatively constant since 1980. However, the share of people aged 65 and over grew by 6.0 percentage points, while the percentage younger than 18 fell by 6.3 points.
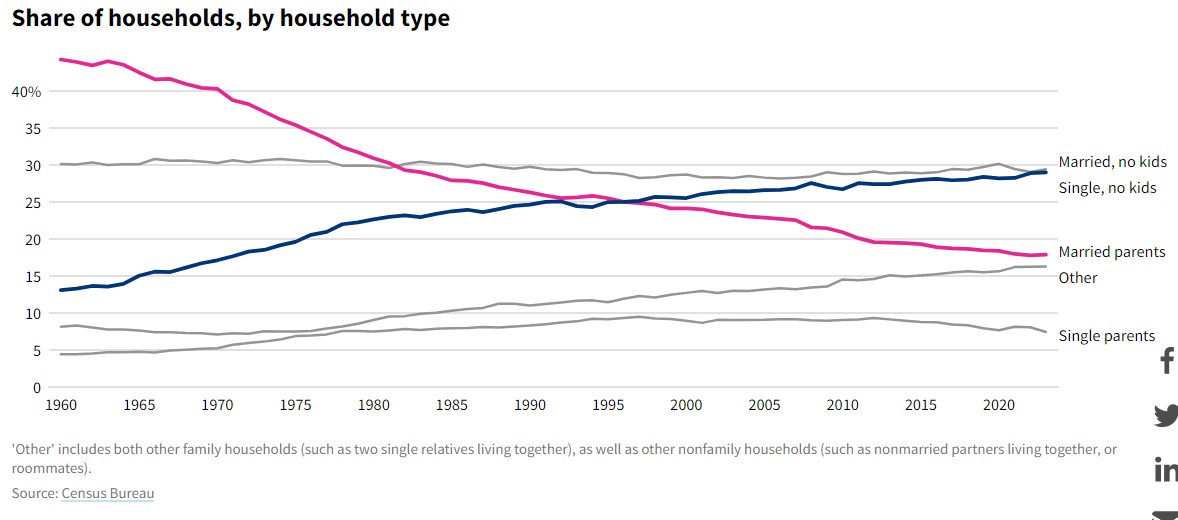
Single adults without kids comprised 29.0% of all US households in 2023, up from 13.1% in 1960.
The share of households headed by married parents declined from 44.2% to 17.9% between 1960 and 2023.
The results of this report do not portend well for the United States. As the population ages, we will not have enough Labor to supply companies even if companies move back from Asia. You can see similar in Europe which has a much older Labor Force. Joel Garreau talked about a much younger US workforce (-35) in 2006.
U.S. Population Trends Return to Pre-Pandemic Norms (census.gov)
U.S. Fertility Rate 1950-2024. www.macrotrends.net. Retrieved 2024-05-27.
Quantitative changes in population growth vs. Qualitative changes in population growth lead to totally different outcomes in the culture of the population= Is the USA’s culture improving or declining with our population growth since each person’s Character is unique is the question.
@Jackson,
What metric do you propose to measure “the USA’s culture?”
The incarceration rate per 100,000 population in USA exploded following the passage of the Great Society in 1964 which subsidized the birth of children outside of marriage. 1925 through 2014
https://commons.wikimedia.org/wiki/File:U.S._incarceration_rates_1925_onwards.png
@Jackson,
So the incarceration rate/100,000 is your metric? Birth of children out of wedlock is your metric?
You do know that correlation ≠ causation, don’t you? Never mind that this doesn’t demonstrate that either the incarceration rate or out-of-wedlock births have increased among the immigrant population since 2020.
Joel what event in the late 1960’s early 1970’s caused the chart of incarceration to accelerate skyward if not the Great Society welfare system.? Causes always correlate with results.
@Jackson,
“Causes always correlate with results.”
LOL! Yes, but you haven’t demonstrated that your favorite cause, among a small universe of possible causes, is the one that gave the results. BTW, violent crime in the US peaked in 1991, not in the ’60s or ’70s.
For example, incarceration rates are not just a function of crime, they are also a function of incarceration policies. In the ’60s and ’70s, it was fashionable to lock up people for minor crimes like marijuana possession, for example. What is your evidence that incarceration rates of the ’60s and ’70s had anything to do with the welfare system?
@Jackson – The big driver of incarceration was the War on Drugs. It led to long sentences for what we would now consider minor drug offenses. There is also a lot of evidence for the theory about leaded gasoline leading to more criminal behavior, particularly violent crime.
So you all think the CULTURE of the USA has improved since the 1964 Great Society LBJ vote buying scheme of the Democrat Party ? Obviously you haven’t left your gated community and gone to a public high school lately. Let’s hope you’re never confronted with a request for all your money and car.
@Jackson,
LOL!
Yes, I certainly believe the CULTURE of the USA has improved dramatically since the 1964 Great Society of LBJ. Obviously you haven’t left your gated community and gone to a public high school lately. I have.
I’ve never lived in a gated community. However, I did live and work in St. Louis for 40 years (1982-2022) and was never confronted with a “request” for all my money and car. I was never a victim of any crime. Neither was my wife. Neither was my daughter, who when to public schools in St. Louis for 12 years, then came back for three years of law school after college.
Since you seem to believe correlation = causation, consider that audio cassettes, lasers, the oral polio vaccine and programmable desktop calculators debuted in the 1960s and thus by your reasoning might have caused the increase in incarceration. It would make as much sense as your Great Society conspiracy theory.
Heh.
i hate to see this…because of the kind of feedback i am going to get, but
“good for the economy” is a bad way to think about anything. good for quality of life might be better, if so many people weren’t convinced that “more money” IS quality of life.
readers at AB ought to know by now that an “aging” population is not a burden on the young. the young can pay for their own retirement by raising their own payroll tax about 2% while their income will grow more than 20% and keep growing forever, until overcrowding chokes off meaningful “economic growth,” it already has destroyed a great deal of what makes life worth living in this country.
the only “good” reasons for population growth is to have a bigger army than the other guy, and to provide a larger pool of money for the people at the top of the food chain…who can then buy an imitation quality of life by closing off the commons.
by the way, finding a “metric” to measure quality of life is another bad way to think about things.
well, i hate to look back and see my typos:
“i hate to say this” not “I hate to see this.”
I assume that the folks worried about falling world population are terrified that we’ll return to the horrors of the 1960s or something. Life back then was far from utopia, but we aren’t much closer now. The thing is that we know what the world was like with a population of one billion, two billion and so on. It’s terra cognita.
Kaleberg:
I believe you might want to look at Replacement Rate. For sure, it is less than 2 in the US at about 1.6 to 1.7. The last time it was 2+ was 2006. The same holds true for much of Europe. Even in Africa it is declining although still at 4.1.