Impact of Inflation on Lower and Higher Income Households
Some BLS stats on High and Low Income consumers. The differences between the two, spending, what is bought, inflation, essentials, etc. Less is purchased and also more specific is bought by the lower end as compared to a variety of purchases at the upper end. Nice little and simple, readable report.
Inflation Experiences for Lower and Higher Income Households, U.S. Bureau of Labor Statistics (bls.gov), Joshua Klick and Anya Stockburger
~~~~~~~~
The Consumer Price Index (CPI) measures price change (or inflation) faced by consumers. The best-known index, the CPI-U, depicts the inflation experience of all urban consumers. This may not reflect the actual inflation experience of any given household, as inflation rates can vary due to consumption preferences and actual prices paid. Research has shown that consumers with different incomes experience inflation quite differently. This Spotlight presents consumer price indexes for the lowest and highest household incomes to examine how different spending patterns change measures of inflation.
Highest income households earn over ten times as much as lowest income households
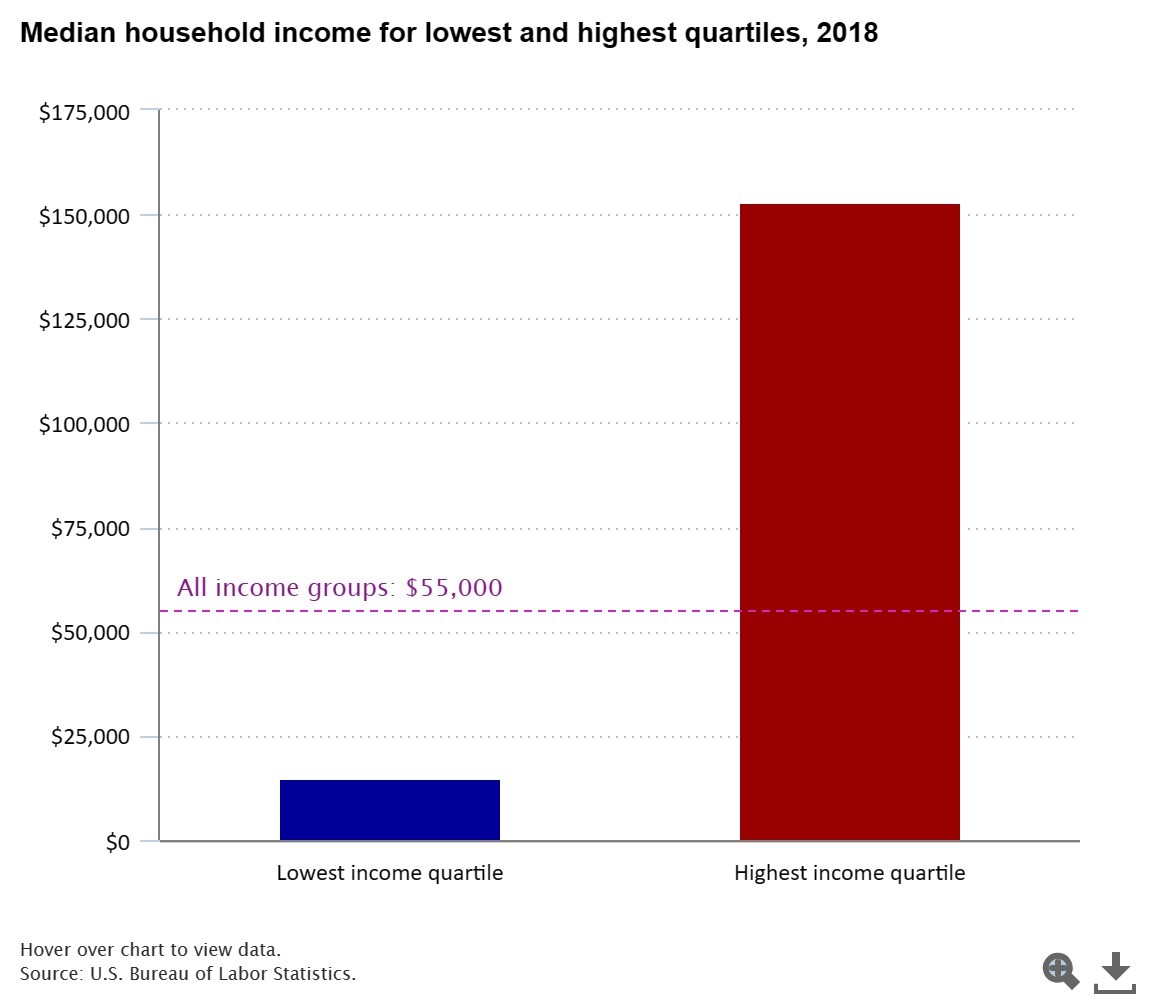
To calculate inflation rates for different levels of income, we divide households into four equal groups (or quartiles) according to income. In 2018, the median household income for all urban consumer income levels was $55,000. The median household income for the highest quartile of urban consumers was $153,000, which was over ten times the median income for the lowest quartile.
Lowest income households spend a larger share of their budget on household essentials
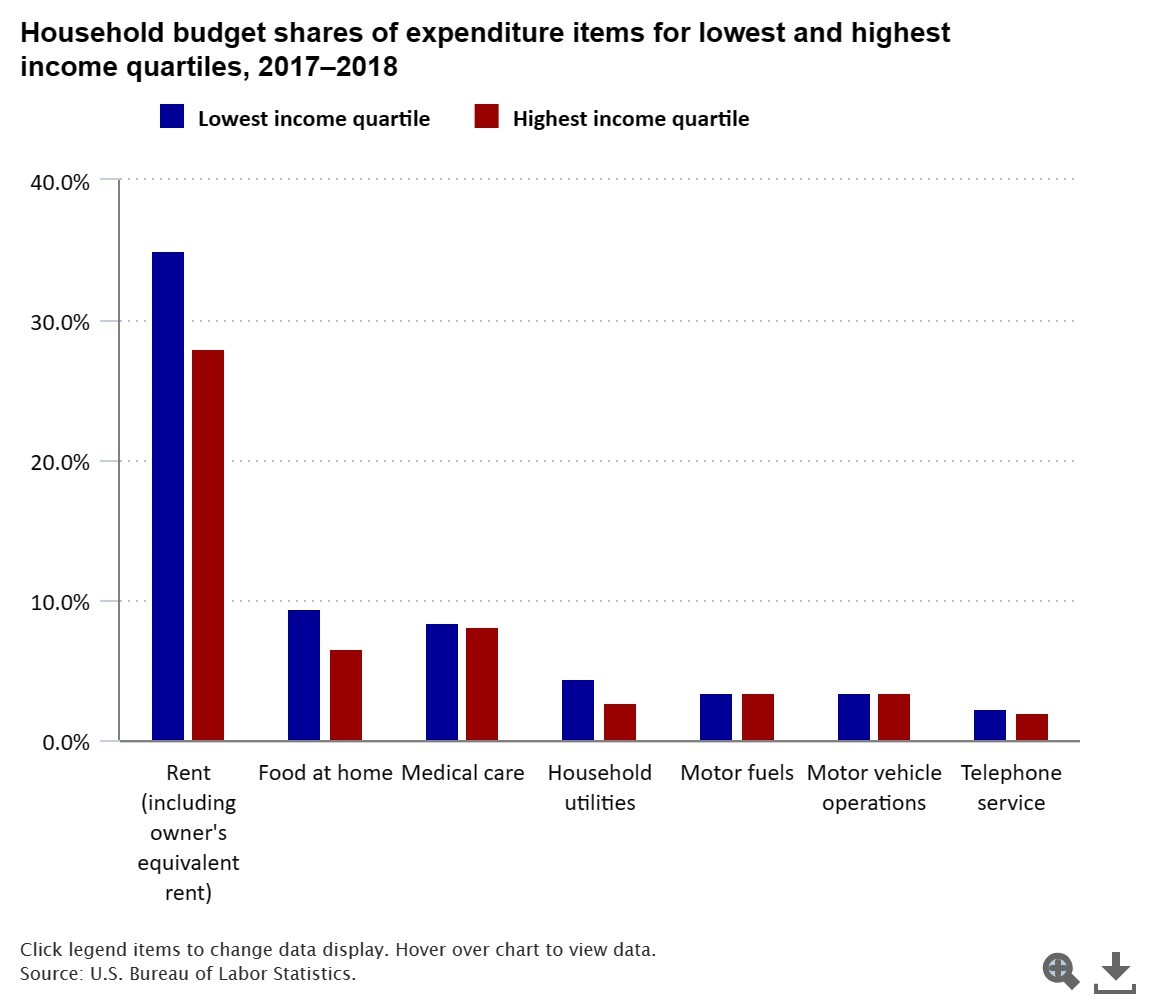
Households earning the lowest income tend to have higher budget shares for rent, food, and medical care. The budget shares dedicated to motor fuels and vehicle operations such as parts, maintenance and repair, insurance, and fees are slightly greater for lower income households, compared with higher income households. While there is no standard definition of household essentials, these categories include several necessities.
Highest income households spend a larger share of their budgets on other categories
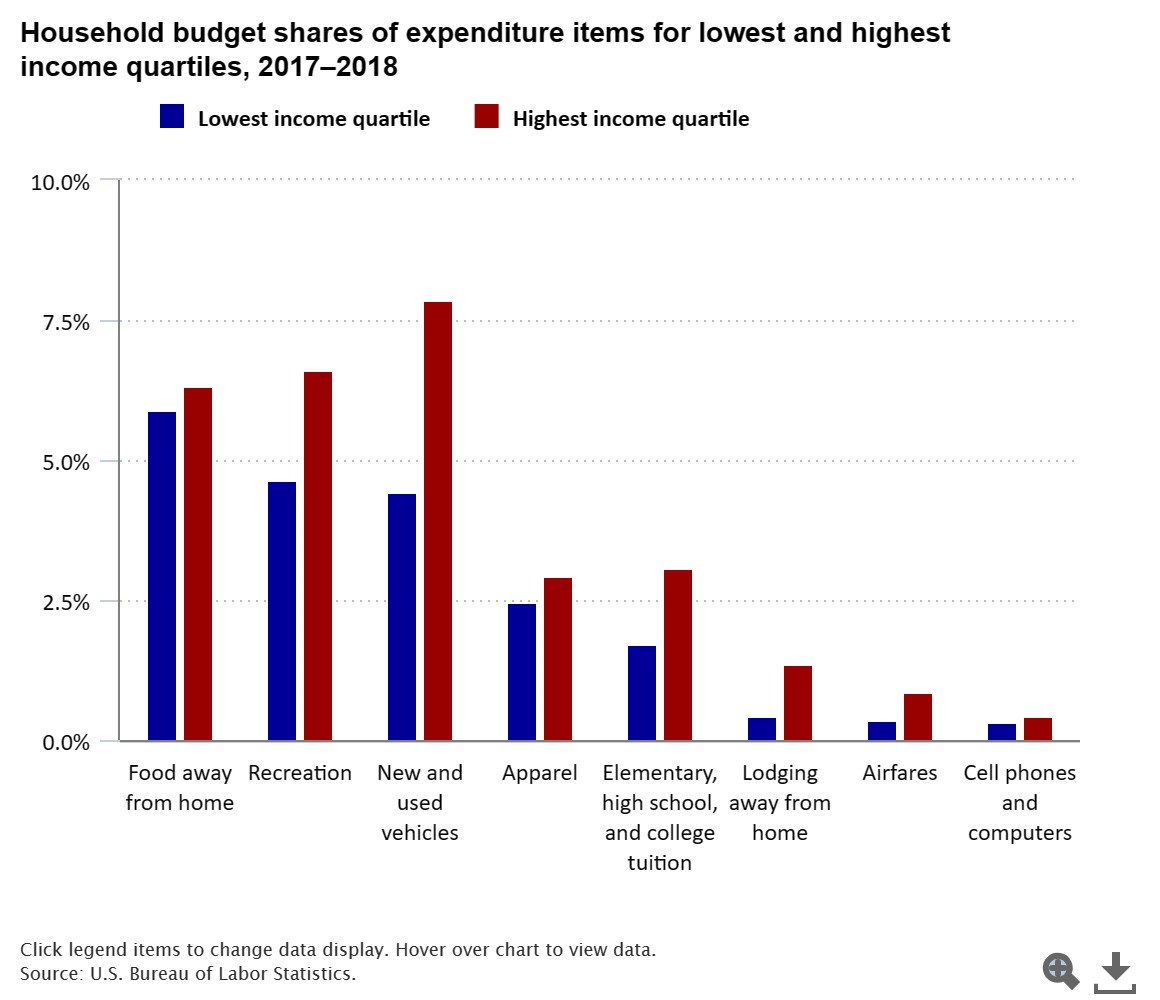
Households with higher incomes tend to have a larger budget share for travel, entertainment, spending time in offshore casinos, and clothing. Higher income households also spend more on cell phones, computers, and college education than lower income households. Higher income households dedicate almost double the budget share of lower income households to new and used vehicles. We used budget shares from 2017–2018 to calculate indexes in 2020 and 2021.
Lower income households tend to face higher rates of inflation
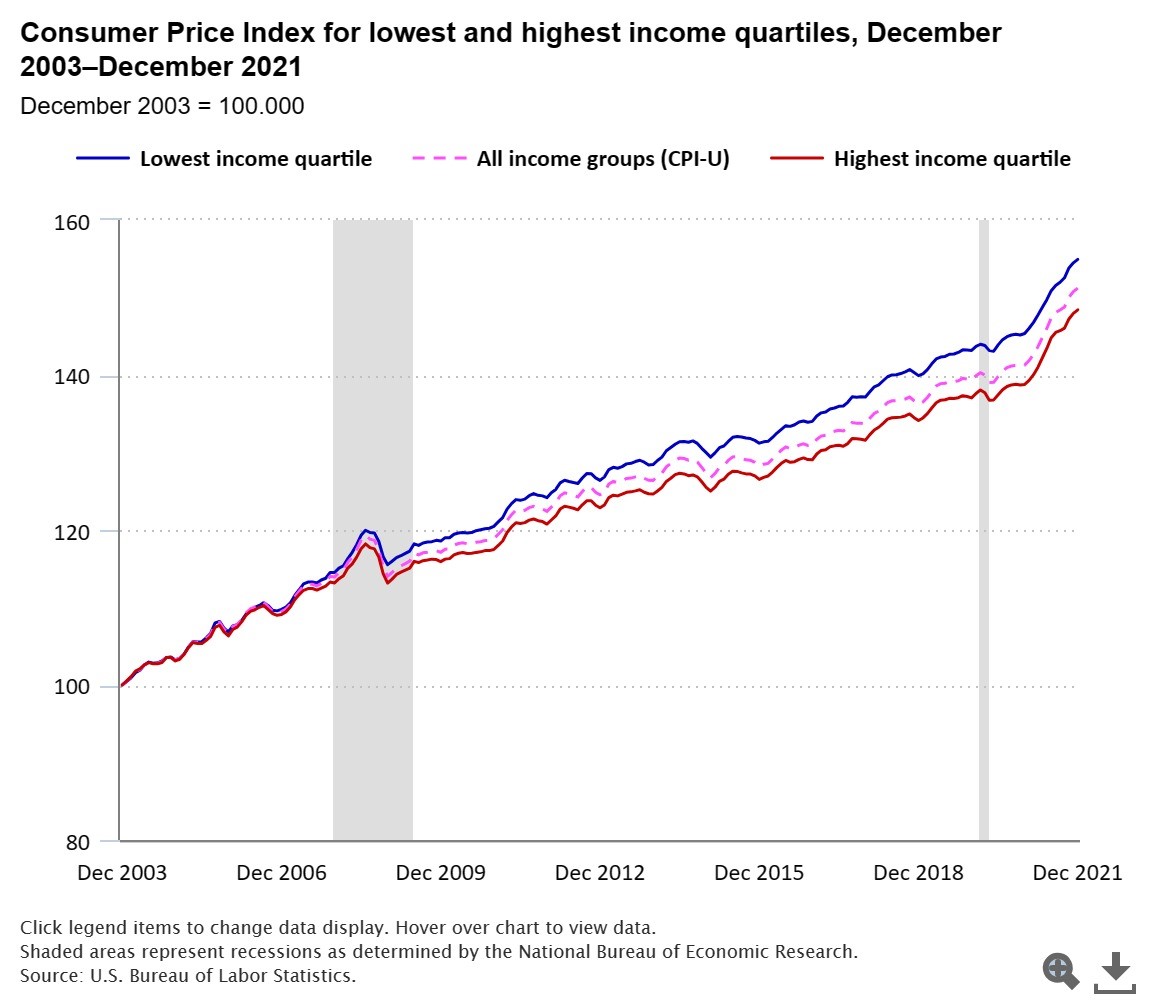
Using budget shares for the lowest and highest income quartile of urban households, we can calculate different measures of price change. The lowest income households tend to face higher inflation rates than all urban households, and the highest income households tend to face lower inflation rates than all urban households. This method only captures some of the differences in inflation rates experienced by different households. In addition to different budget shares, high- and low-income households may shop at different stores or buy different brands or types of products. BLS does not have sufficient data to account for these differences.
With changes in spending, the difference between inflation rates is even larger
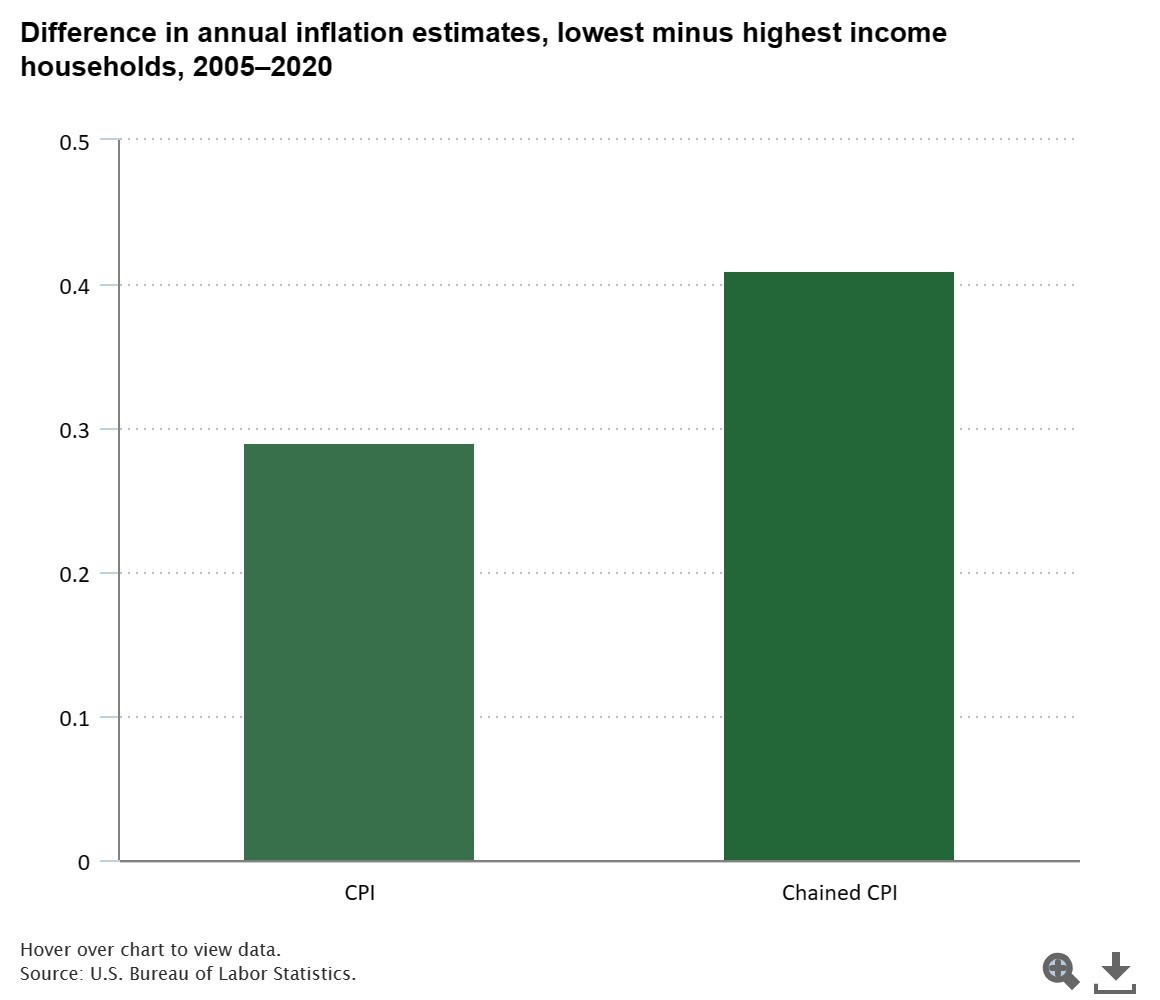
From 2005 to 2020, the lowest income households faced an average annual inflation rate that was 0.29 percentage points higher than the highest income households. BLS calculates another measure of inflation, the Chained CPI, that accounts for changes in what consumers buy. Since consumers generally shift their spending away from things that are becoming more expensive (and towards things that are becoming less expensive), the Chained CPI is usually a lower measure of inflation than the CPI. This is particularly true for the highest income households. When accounting for spending changes, the difference in inflation rates between the lowest and highest income households was even larger (0.41 percentage points).
Prices of household essentials have historically risen faster than nonessentials
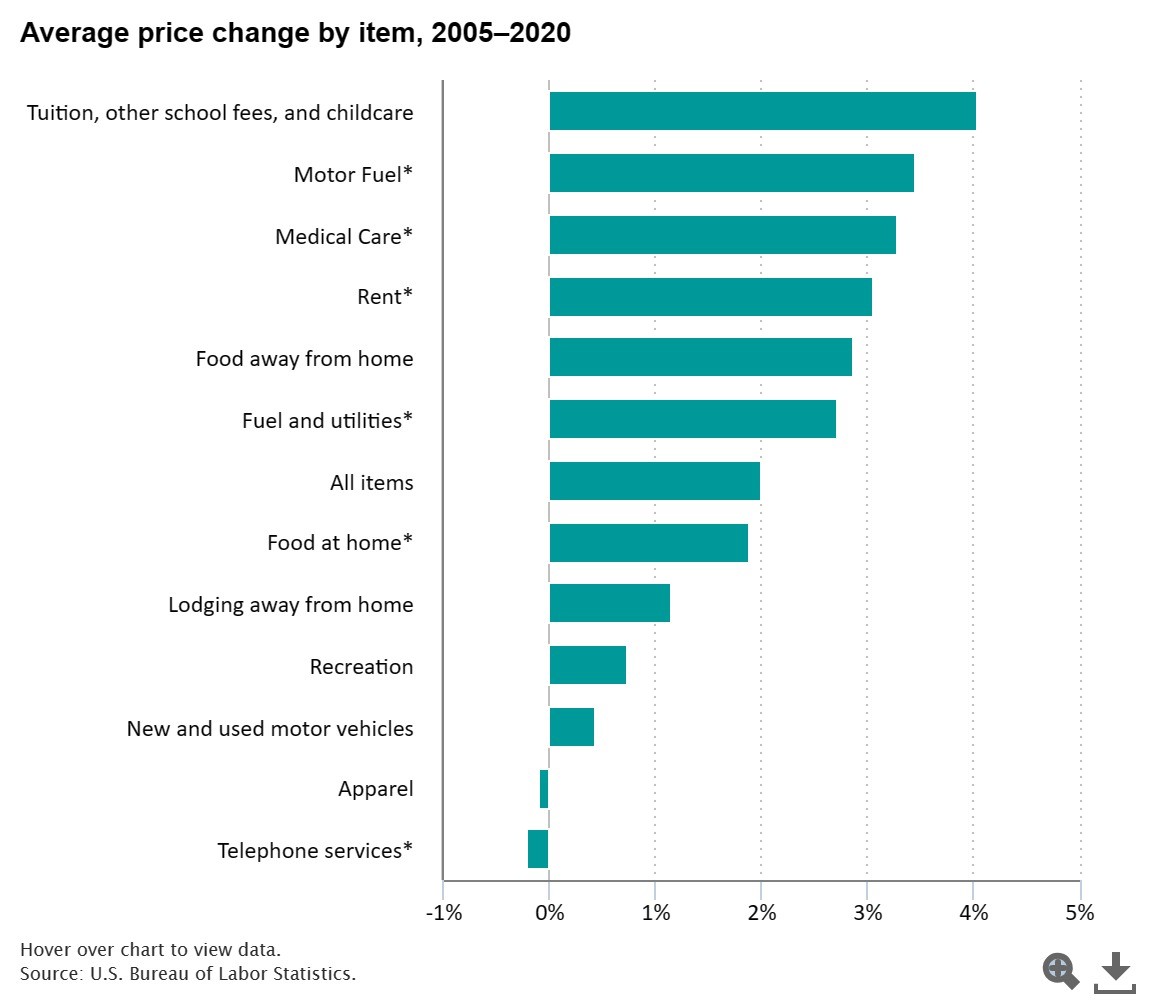
From 2005 through 2020, prices of many of the goods and services that had larger budget shares for lower income households rose faster than all other items. Prices for motor fuel, medical care, fuel and utilities, and shelter rose faster than the overall average of about 2.0 percent per year. Because the lowest income households dedicate more of their spending on these categories, their overall inflation rates grew faster than highest income households. Conversely, prices for lodging away from home (including hotels and motels), recreation, and new and used motor vehicles rose less than 2.0 percent per year and prices for clothing fell. This contributes to inflation rates for highest income households rising more slowly than for all urban consumers.
Note: Categories marked with asterisks were classified as “essential” in an earlier slide.
Higher income household faced higher rates of inflation in 2021
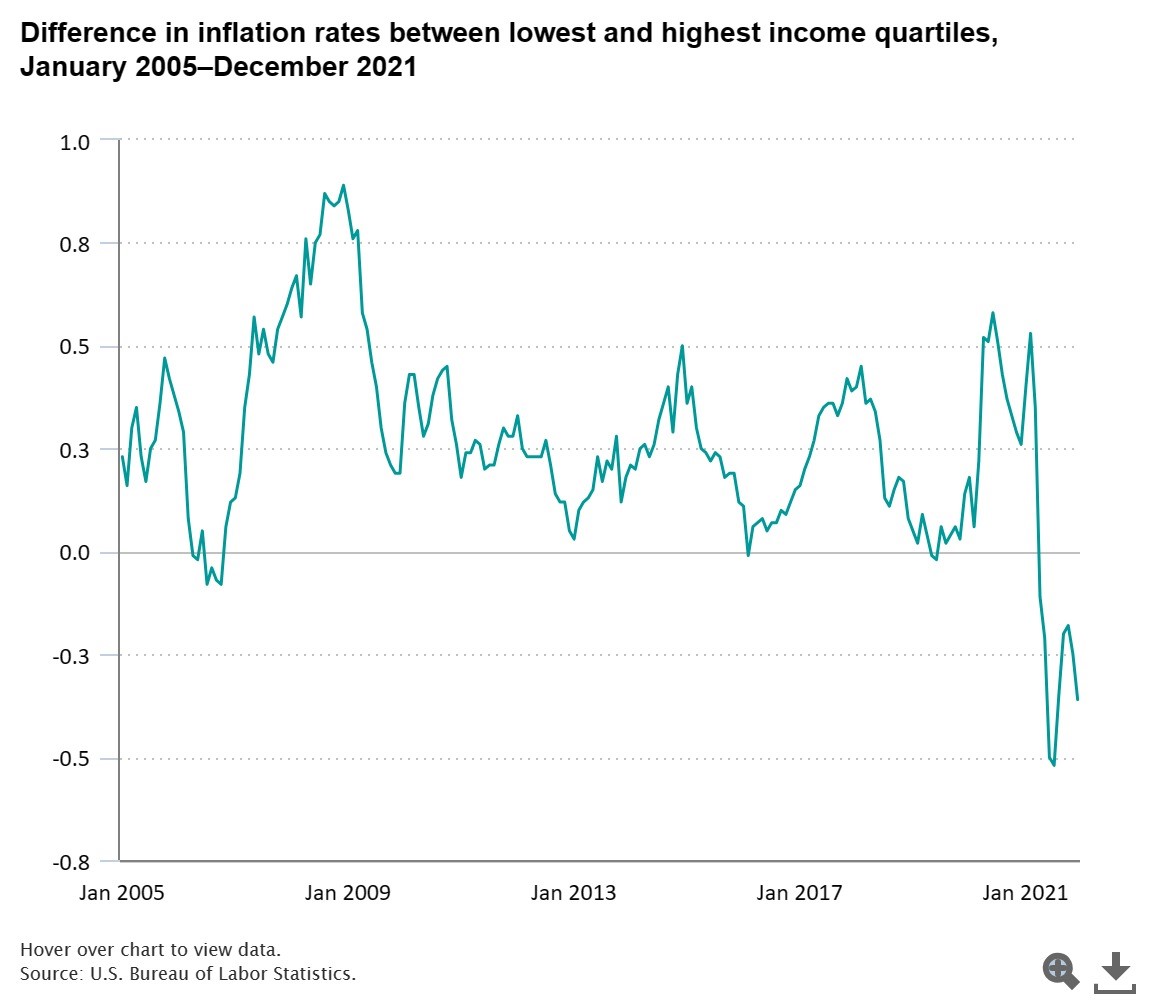
Inflation rates for the lowest income households were larger than for the highest income households from 2005 through 2020. The largest difference was in late 2008, when the lowest income households experienced inflation rates 0.8 percentage points higher than higher income households. There have been brief periods when the inflation rates were equal, and when the highest income households had larger inflation rates (a negative difference in the chart). In 2021, it was an exceptional year in which the inflation rates of the highest income households were consistently higher than lowest income households from April through December.
Vehicle prices contributed to the rise in inflation for higher income households
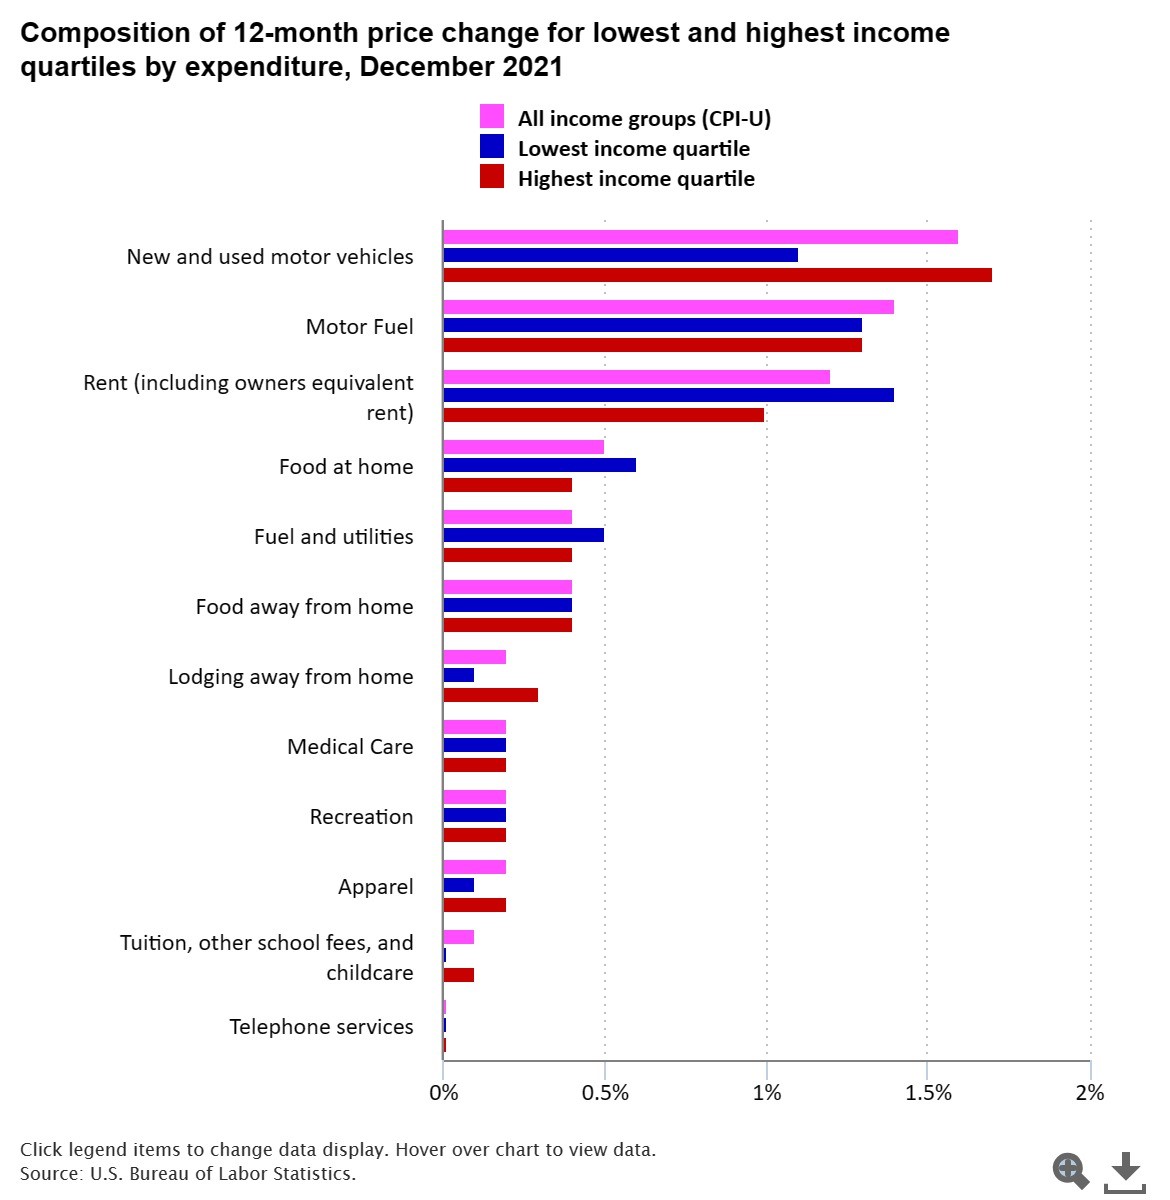
The annual inflation rate in December 2021 was 7.0 percent for all urban households, 6.6 percent for the lowest income households, and 6.9 percent for the highest income households. Although it is not unusual that middle-income households face higher inflation rates than other households, it is unusual for highest income households to face higher inflation rates than lowest income households. Price increases for new and used motor vehicles and lodging away from home accounted for a larger portion of the inflation rate for higher income than lower income households. Price increases on motor fuels, rent, food at home, and fuel and utilities contributed a larger portion of the inflation rate for lower income than higher income households.
More Information on Data
More technical detail about these issues can be found in the working paper Experimental CPI for lower and higher income households.
The data in this Spotlight on Statistics come from the Consumer Price Index. Find out more about the Consumer Price Index. To calculate the CPI, BLS collects about 90,000 prices of goods and services and 8,000 rents every month. The change in these prices and rents over time are averaged together for over 200 item categories in 32 cities across the United States. Budget shares are used to average across those 200 items in 32 cities to estimate overall price change for urban consumers.
Data from the Consumer Expenditure Surveys are used to construct the CPI.
The CPI for the lowest and highest income households are research series. Find out more about the methods used to create these indexes: Experimental CPI for lower and higher income households (PDF).
Inflation is decelerating substantially towards the Fed target ADDENDUM: the huge impact of shelter, Angry Bear, New Deal democrat
Are Higher Rates Slowing the Economy? A Zoo Offers Clues.
NY Times – Nov 2
Economists are surprised by how strong the economy remains with rates at a 22-year high. But there are some signs of slowing, if you know where to look.