February Mfg. and January Const. Continue Negative, while Auto Sales Improve
February manufacturing and January construction continue negative, while auto sales improve
– by New Deal democrat
We started out yet another month of data with bad news in two leading sectors.
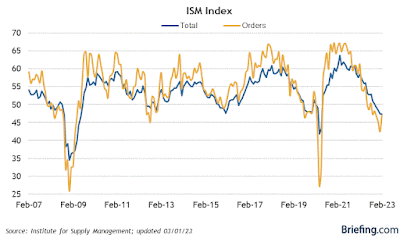
The ISM manufacturing index has been showing contraction since November, and its more leading new orders subindex since September. And did so again in February, with the total index increasing slightly to 47.7, and the new orders index rebounding from a horrible 42.5 to 47.0. But because both of these numbers are below 50, they still show contraction:

In the past, the ISM has said that numbers below 48 have been most consistent with recession.
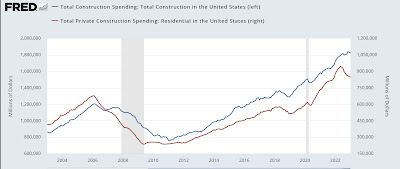
Meanwhile, construction spending for January also declined by -0.1%, and the more leading private residential construction spending declined by -0.6%:

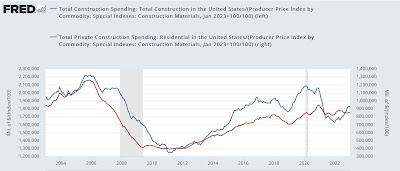
Even after factoring in the prices for construction materials, which declined -0.1% in January, “real” residential construction spending declined -0.5%:

Finally, in a bit of relatively good news, it appears that the crunch in motor vehicle production may have eased somewhat, as in January 15.7 million autos and light trucks were sold on an annualized basis, the highest number since June of 2021 (the below graph norms that to 0 to better show comparisons):

A more typical expansionary reading before the pandemic would have been between 17.0-18.0 million units annualized, so this is still a shortfall, but is much closer to a normal range than we have seen in the past year.
When February payrolls are reported a week from this Friday, the leading sectors of manufacturing and construction jobs, neither of which has turned down as of now, will be of special importance.

there were substantial upward revisions to November & December construction…the December spending estimate was revised from the $1,809.8 billion annual rate figure published a month ago to $1,827.5 billion, while November’s annualized construction spending was revised from $1,817.3 billion to $1,840.3 billion…since those figures are already annualized, the combined upward revisions of $40.7 billion to November and December construction spending figures would be averaged over the 3 months of the 4th quarter and therefore raise the quarter’s annualized construction spending by almost $13.8 billion across the GDP components it is source data for, and would thus conservatively imply an upward revision of about 0.22 percentage points to fourth quarter GDP when the third estimate is released at the end of March, assuming there are no major changes to or imbalances in the previously applied inflation adjustments…
for inflation adjustments, i use the producer price index for final demand construction as an inexact shortcut to make the needed price adjustment and come up with an estimate…that index showed that aggregate construction costs were up 1.6% in January, after they had been unchanged in December and had risen by 0.1% in November….using that, i figure real construction spending in January was down 1.59% vis a vis that of the 4th quarter, or down at a 6.22% annual rate…
that estimate could be well off the mark, though, because the BEA uses a couple dozen different deflators for different types of construction listed in the National Income and Product Accounts Handbook, Chapter 6 … i’ve never tried looking them all up; some are pretty obscure…
http://longwavegroup.com/market/charts/_pdf/Kondratieff_Cycle_Chart.pdf
The US Hegemony 1807 Quantitative 36/90/90/54 Year :: x/2.5x/2.5x/1.5x Four-Phase Longwave Pattern Ending in 2074
Debt expands and the economy, its assets, and its assets’ valuations increase to a summation peak and thereafter collapse with bad debt liquidation, asset redistribution, and a nadiring in asset prices. No one argues that this process is cyclical; but is there an underlying self assembly time-base fractal ordering process that the asset-debt system intrinsically follows?
A Wilshire 16-17/40/40/24 day :: x/2.5x/2.5x/1.5x fractal series from the Wilshire average absolute low on 12 October 2022 – and an interpolated 19/48/38/27 day :: x/2.5x/2x/1.5x series from a preceding secondary low on 26 September 2022 (which ended a 9/22/23 days series starting 14 July 2022) – will both end on 31 March 2023. Within these two interpolated series, the shorter sub-series fractal patterns have been remarkably elegant conforming to the asset-debt system’s ubiquitous self-assembly simple growth and decay fractal patterns.
The current daily decay fractal model taking the Wilshire (and global equity markets) to a 31 March 2023 low is a y/2y-2.5y/1.5y decay patten starting on 30 January 2023 : 10/21/15 days. The first ten day fractal series is composed of a 2/5/5 day first fractal base. The second fractal is composed of two sub fractals: 2/5/5 and 2/5/5/3 days. Currently the self assembly system is on day 4 of the second 5 day subfractal (hence the increase in valuation today). The third 15 day decay fractal series which will likely contain the 1981 13/31 of 32 year second fractal nonlinearity will likely be either a 3/8/6 or 3/7/7 or a 4/8/5 day three phase decay fractal series.
The ten year note (TNX), which had a valuation gap up today 4.07% , is following a March 2020 20/75/53 of 60 week x/2.5x/2x growth series(higher interest rates ..) It will not reach the (2x) 60 week third fractal valuation peak. As equities collapses, two events will happen; one: money will flow from equities (and bank accounts) into US debt instruments driving interest rates lower, and two: the Federal Reserve will reverse its QT and Fed funds rate increase policies.
A lower low or secondary low will occur in equity markets about 15 months later.
After equity peak valuations in 2000 and 2007-2008 fed funds rates nadired at 1.00 % and 0.25% in June 2003 and December 2008, 8 months after and 3 months before respectively, the nadir of the composite equities. A drop in the fed funds rate to 0 – 0.25 may be a marker for a near time frame nadir in composite equities. Negative long term sovereign interest rates will reoccur in Germany.