Trends in Housing Affordability: Who Can Currently Afford to Buy a Home?
– Nadia Evangelou
National Association of Realtors
A good read explaining why things slowed down. Good introduction of why housing market fell apart since 2020. Much was due to the Fed Rate which was significantly higher than it normally was. People did not have the income to support a higher payment caused by a higher Mortgage Rate. Some excellent charting by NAR Calculations.
Housing affordability has been a critical issue in the housing market, affecting individuals, families, and entire communities. While the challenges associated with affording a home are not new, they have remained one of the main concerns in the housing market. This, particularly as higher mortgage rates have exacerbated the situation. The widening gap between income levels and housing costs causes homeownership to be increasingly out of reach. However, with mortgage rates recently falling below 6.5%, there has been an improvement in housing affordability. Rates below 6.5% make it possible for American families to afford to purchase a median-priced home.
This article delves into the trends in housing affordability and examines how the number of households who can afford to buy a home has changed over the years.
Housing affordability has often been associated with broader economic cycles and demographic trends. For instance, in the late ’70s, the economy was struggling significantly. Inflation surged to 14%, driving up consumer prices and home prices. When mortgage rates reached 17% in 1981, many people could no longer afford the higher mortgage payment. The higher rates were slowing down demand for housing.
Does this ring a bell?
Starting in 2022, the Federal Reserve raised its interest rates a total of 11 times to combat elevated inflation. As a result, mortgage rates have reached 7% on average in 2023, driving home buying out of reach for many people.
While there are various ways to track affordability, the National Association of REALTORS® monitors monthly housing affordability trends using the Housing Affordability Index (HAI) and the payment-to-income ratio. These two measures are critical tools used to gauge the accessibility of homeownership for average households. Specifically, they provide insight into whether the typical family can afford to buy a home and maintain mortgage payments relative to their income.
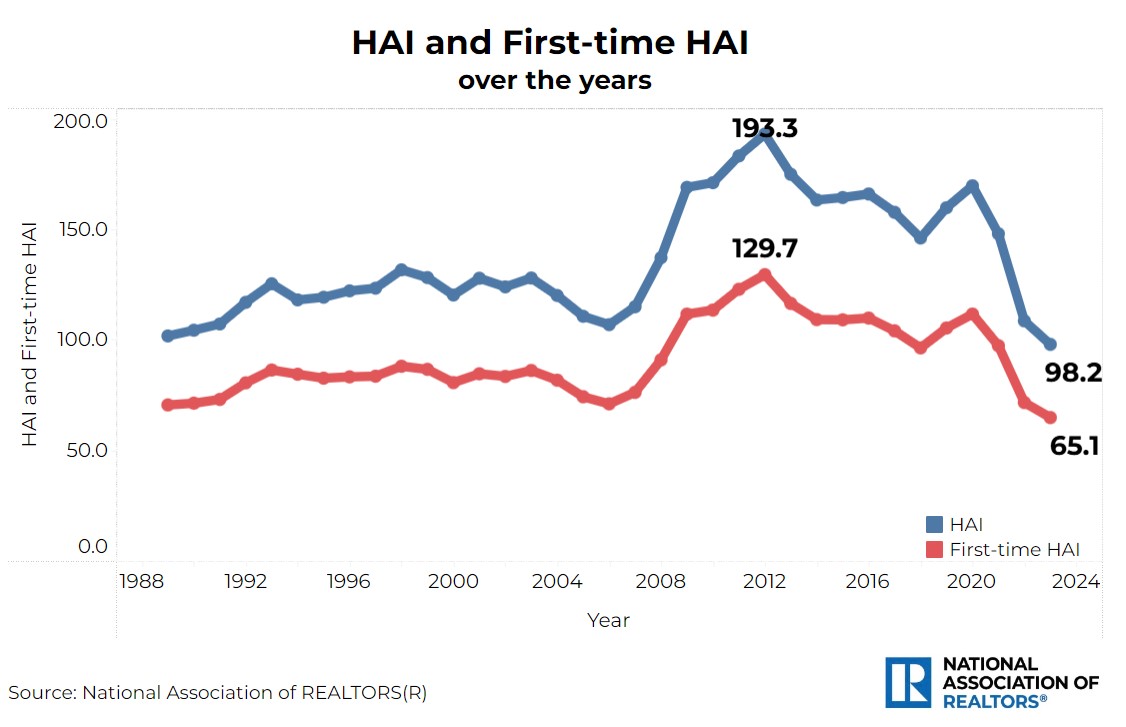
HAI definition and trends
The Housing Affordability Index is a measure that reflects the relationship between median home prices, median family income, and mortgage rates. It is calculated by comparing the income needed to qualify for a mortgage on a median-priced home to the actual median family income. An index value of 100 indicates that a family earning the median income has exactly enough income to qualify for a mortgage on a median-priced home, assuming a 20% down payment. Values above 100 suggest housing is more affordable, while values below 100 indicate it is less affordable.
Looking back at the entire historical data since 1989, housing affordability hit a record low in 2023, with an index of 98.2, indicating the American family earns less than the income needed to purchase the median-priced home. Historically, however, the typical family generally earned about 40% more than the qualifying income, meaning they could afford a home costing 40% more than the median price. In 2012, as both mortgage rates and home prices dropped in the aftermath of the housing downturn, Americans could afford homes priced nearly twice the median price. Affordability has improved since the end of the first half of 2024, with mortgage rates recently falling below 6.5%. While the Federal Reserve is anticipated to begin cutting rates as early as September October, the downward trend in mortgage rates will continue. Rates below 6.5% will bring American families back to the market. There are rates, they can afford to buy a median-priced home without spending more than 25% of their income on mortgage payments.
The HAI is even lower for first-time buyers, reflecting the increased challenges they face in their journey to purchase their first home. Given that the income of first-time buyers is generally lower1 than that of all buyers, first-time buyers earn just 63% of the income needed to qualify for the purchase of a starter2 home. As of the year’s second quarter, first-time buyers can afford to buy a home priced 38% less than the median starter home.
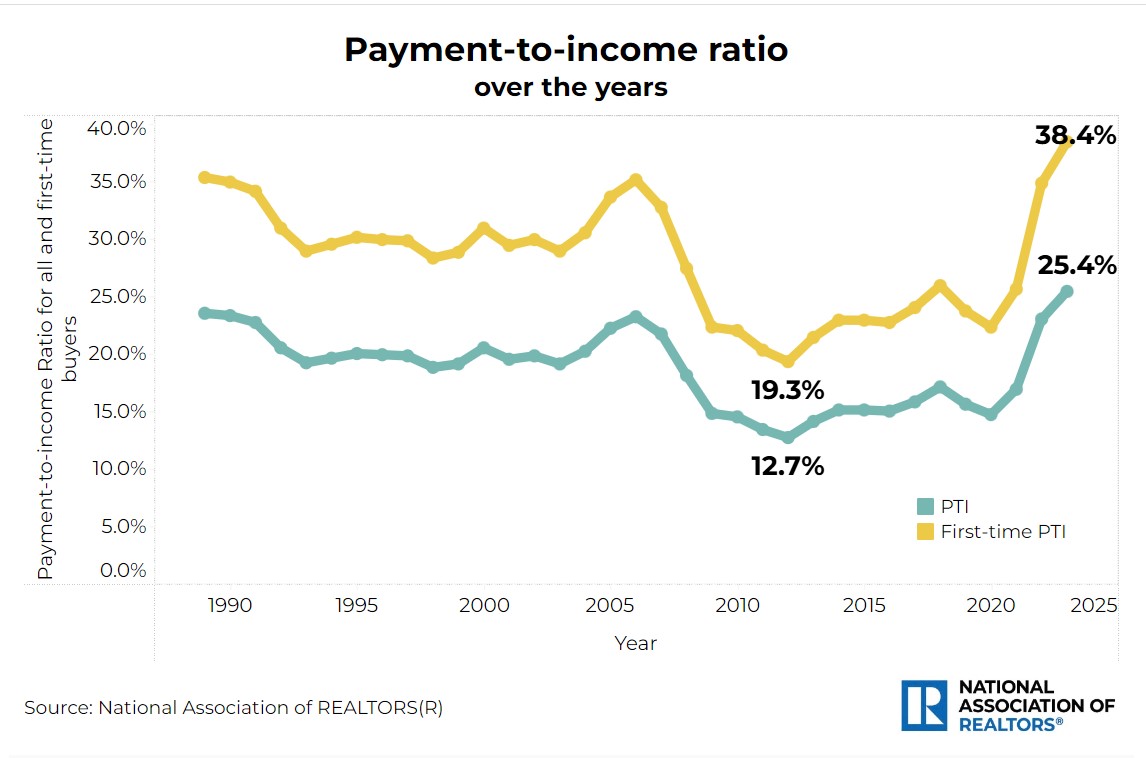
Payment-to-income ratio definition and trends
The payment-to-income ratio is another key metric the National Association of REALTORS® uses to assess housing affordability. Specifically, this ratio represents the percentage of the typical family’s gross income spent on mortgage payments (including principal and interest). While the rule of thumb indicates that housing costs shouldn’t exceed 30% of the income, NAR assumes that the payment-to-income ratio should not exceed 25%. Thus, a lower ratio suggests housing is more affordable, as a smaller portion of income is attributed to housing costs. Respectively, a higher ratio indicates that a larger share of income is required to cover the monthly mortgage payment. However, if the ratio rises above 25%, the typical family is considered “cost burdened.”
Over the years, the payment-to-income ratio has averaged 18.5%, indicating that historically, the typical family spent about 18.5% of their income on mortgage payments. However, mirroring the trend seen in the HAI, the payment-to-income ratio reached its highest level in 2023 at 25.4%. This exceeds the 25% threshold, showing that the typical family is now considered cost-burdened when purchasing the median-priced home. By contrast, in 2012, the ratio was just 12.7%, marking the lowest level ever recorded.
First-time buyers must allocate a substantially larger share of their income to the monthly mortgage payment. As of the second quarter of the year, the payment-to-income ratio for first-time buyers was 40.0%.
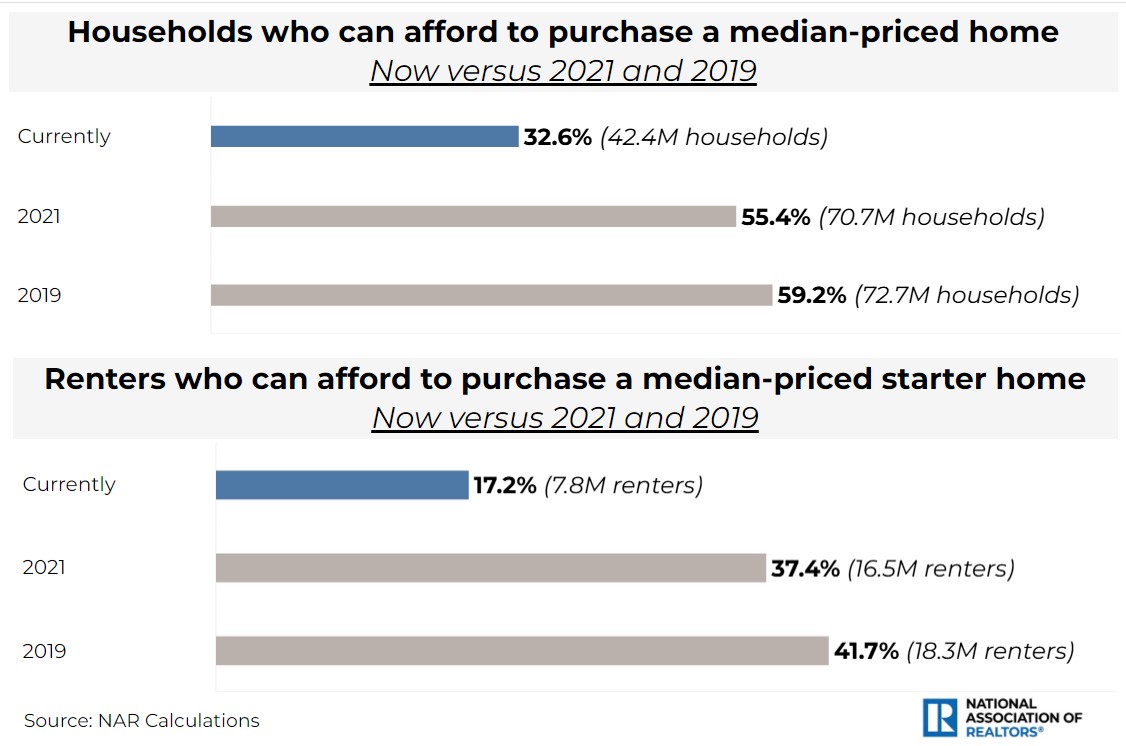
Based on the two metrics discussed, the pool of people who can afford a home has shrunk considerably compared to previous years. Households who once could comfortably afford a median-priced home are now finding it increasingly difficult. As they must allocate a larger portion of their income to mortgage payments.
Currently, one in three households (33%) can afford to purchase a median-priced home without spending more than 25% of their income on their mortgage payment. By contrast, in 2021, when mortgage rates were around 3%, 55% of households met the income requirements. In 2019, before the pandemic, housing was even more affordable, with nearly 60% of households able to purchase a home. Since 2021, 28.4 million households have been priced out of the market while 30.4 million households can no longer afford a median-priced home since 2019.
Seventeen percent of potential first-time buyers (current renters) can afford to buy the median-priced starter home. In 2021, 37% of renter households earned the qualifying income; and in 2019, 42% of renters were able to transition to homeownership. As a result, 8.7 million renter households have been priced out since 2021 and 10.6 million since 2019.
This weakening affordability in recent years has far-reaching implications for individuals and families. Homeownership has historically been proven to be one of the primary ways of building wealth as home values appreciate over time. In the last decade, homeowners built over $200,000 in wealth from price appreciation. When people are priced out of the housing market, especially first-time buyers, they miss out on this opportunity to accumulate wealth. Instead of building wealth, they spend a substantial amount of their income on rent, which doesn’t contribute to asset accumulation.
Notes:
1 The income of first-time buyers is assumed to be 65% of the median family income.
2 The value of a starter home is 15% below the median price of a single-family home.
Long been a quibble of mine: it’s not ‘buying’ a house, it’s a long-term lease where the leaseholder has transferred all of the expense of the lease ~ insurance, maintenance, repairs and utilities ~ to the leaser. While some may realize a capital gain very few see it through
It’s not like the old days where you could ‘buy’ a house on a unionized sawmill salary and raise kids and grand kids and now great-grandkids. Sawmill’s gone
If I didn’t have an allergy to tin-foil: it’s a trap not unlike Plato’s Cave. Traps people into being wage-slaves to dream that can barely be seen. There’s a good chance the bank that owns
youyour house is in cahoots with the one that owns the business you’re wage-slaved to …@Ten,
We paid off our first mortgage after 20 years, and haven’t had one for over 15 years, so I’d say we “bought” and “owned” each of our houses. That said, that first house we lived in for 35 years performed poorly as a financial investment. But (a) our daughter went to public schools from K-12, graduating as a National Merit Scholar, and (b) you gotta live somewhere. I’m not optimistic that our current house will do any better as an investment, but it’s near our grandson and his parents, which makes my wife very happy. How do you monetize domestic tranquility?
I tried to allude that there are exceptions and yeah, what price tranquility?
It’s hard not to put on a tin-foil hat, hence Plato’s Cave. Everything, not just houses, is generally just out of reach and you have to enter into some kind of a relationship with a bank to achieve them. The house or the car is just a little more than out of pocket, your employer unwilling to pay more than just enough. And this isn’t new, not limited to my kids’ generation: the original title (and ongoing address) of my web-site is a metaphor my having never been able to ‘buy’ a house. That all of that is inter-related is no doubt as tin-foil as car-makers and big oil colluding to suppress electric vehicles
I commend you, genuinely, congrats …
@Ten,
Thanks.
As for cars, my wife and I didn’t own a car for the first four years of our marriage, which got me to the age of 26, beyond peak insurance rates. We did finance the first car, but that was because (a) our money was earning more in a money market mutual fund than the loan interest and (b) auto loan interest was tax deductible back then.
Cars are cost centers, not investments. We try to minimize the cost by driving our cars into the ground. Mine is ten years old, her’s is 21 years old. That’s not how most Americans roll.
When I bought my first home the FHA rate was 7%, plus the insurance, so 7.5%. Like today, pretty much. The rule-of-thumb for affordability was 2.5 times your gross income. If we approximate median at 80K – household income of course – that would mean a $200,000 home.
I just looked at all the homes for sale in my town for $220K or less. There are two or 3 empty lots, and quite a few mobile homes. Stick built homes are all more than that. Two of the mobiles are almost 1800SF, but most are in the 1440 or less range. A lot of 2 beds, 2 baths, probably very doable for a young couple or a young couple with a child. Not surprisingly, the school bus stops in front of the parks near me, and has for decades. With the amenities of the bigger parks, they are very nice places to live. The bigger parks have family sections so the older retirees can have some peace and quiet. Down in our big city (lol) you could add a few 1000SF condos, but no stick built homes for 200K or less.
I don’t think living in a mobile home park, or even a “modular development” aka mobile homes on permanent foundations is what most Americans think of as buying a home, no matter how big or nice they are.
The tract just behind us started around $490,000 after the price reduction, for their single story 1800+ SF smallest home. Affordable for a family making twice the median.