Earned Labor Income Is a Small and Weak Lever. Unearned Property Income, and Wealth, Rule
Reversing extreme wealth concentration means going after property income.
Originally Published at Wealth Economics
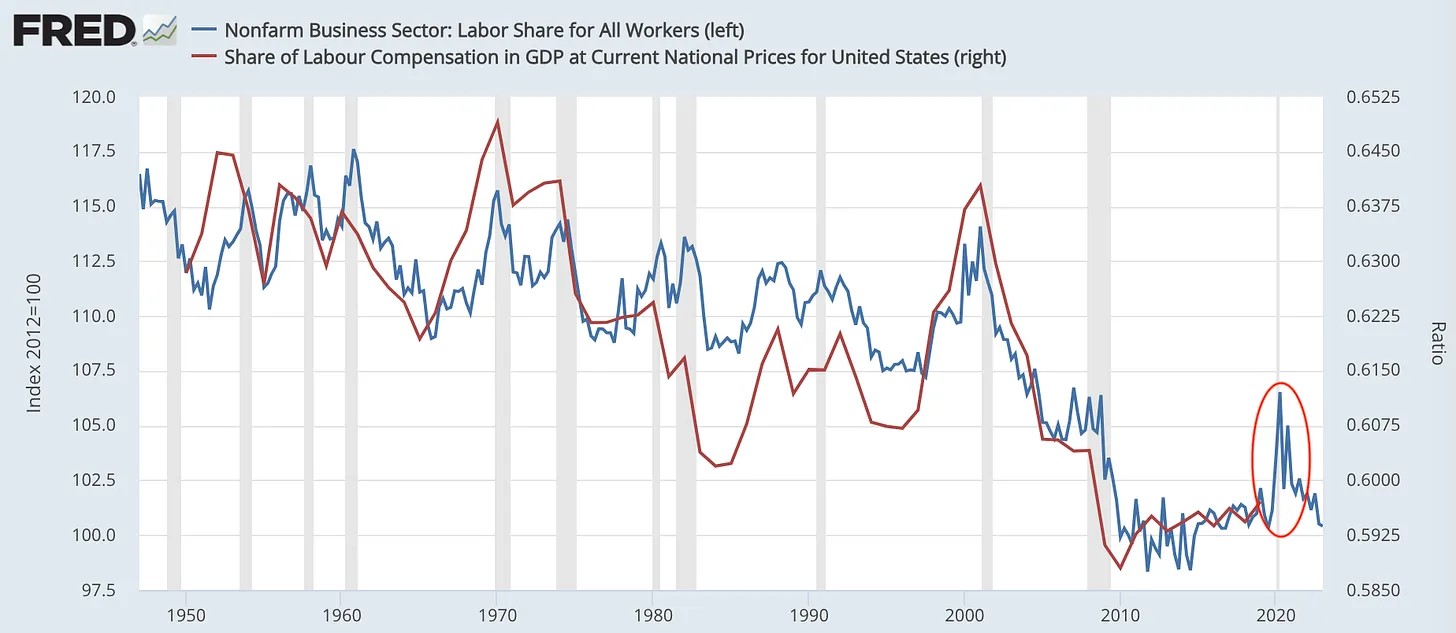
Economists and pundits have been cheered of late by the labor-share increase during the first couple of years of the Covid era. And even, for a moment, lower-income workers were making progress vs higher-income folks. This is good news. In the long view, though, these happy developments are just a minor blip in the half-century decline post-Reagan, which drove off a cliff from the Dot-Bomb through the Global Financial Crisis.
These measures are meaningful, but they don’t put across the sheer volume and magnitude of the disparity, and the shift. And they don’t impart the end result: extreme and increasingly concentrated wealth, with all its pernicious effects.
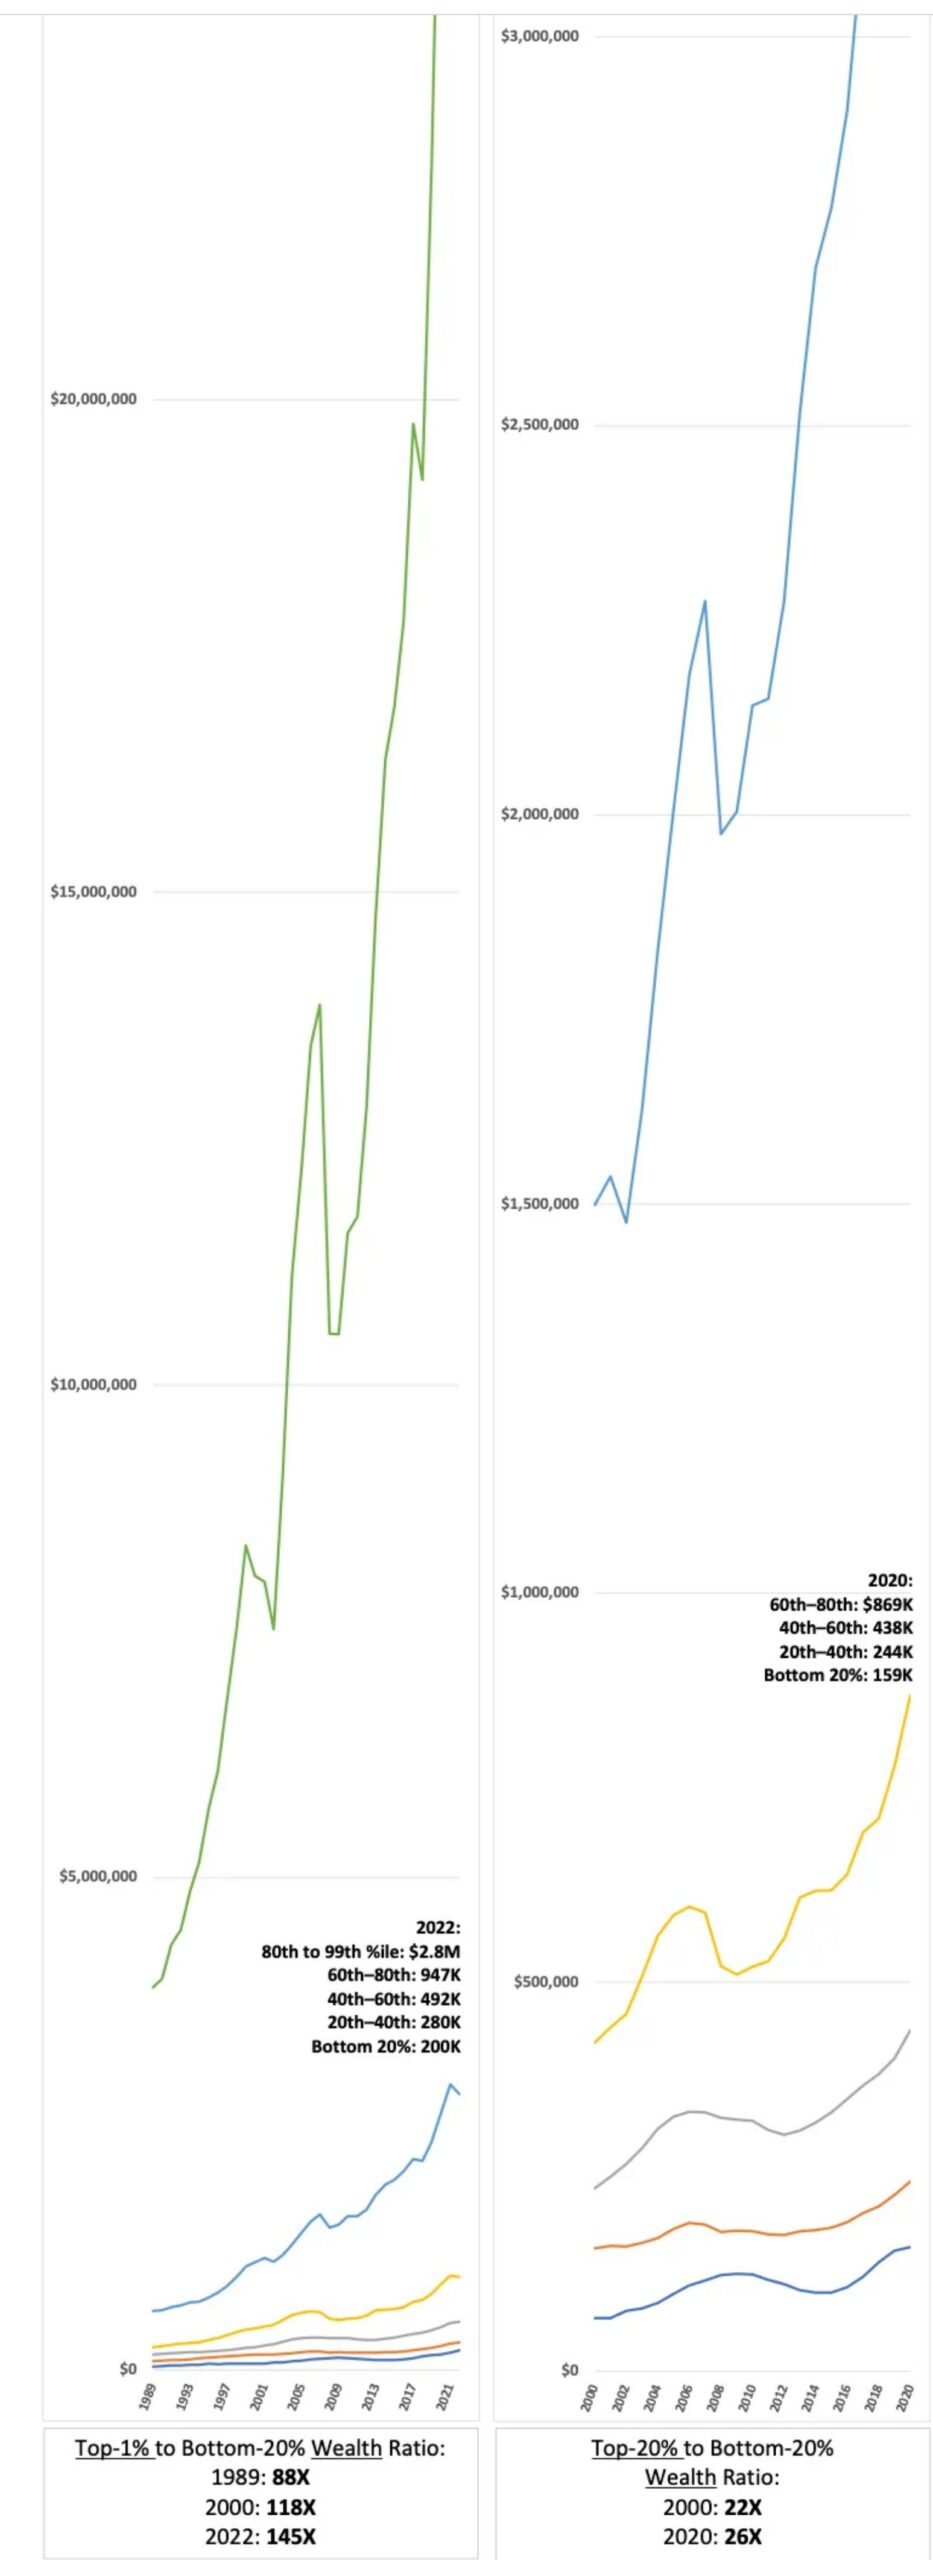
The most eye-popping results are for the top 1%, in the first graph spanning 34 years. It needs to be very tall just to make the lower-quintile lines visible. An average top-1% household has 145 times as much wealth as a bottom-20% household. That’s almost doubled from the 1989 ratio. (Note that top-percentile wealth barely stumbled in the dot-bomb. The epochal GFC collapse was tougher; top-1% wealth took a whole six years to bounce back.)
The second graph rolls top-1% wealth into the top 20%, and runs from 2000-2020, so it’s comparable to the next three graphs. The top quintile still made impressive wealth gains in that picture, increasing the top vs bottom ratio from 22X to 26X.
But where did all that top-end wealth come from? From “income,” natch.

These graphs obviously show much smaller numbers. They’re annual flows, not accumulated stocks. But the ratios at the bottom are meaningfully comparable.
The first thing to notice is how small top labor income is, comparatively. That income is pretty concentrated with its 16.4X ratio, and that ratio has increased quite a lot, but the sheer (small) magnitude can’t explain much of the extreme wealth concentration we’ve seen.
Personal income (earned income + “primary” property income + net transfers) seems to show a slight ratio improvement over 21 years, from 9.6X to 9.1X. But that’s an artifact of big 2020 covid transfer payments juicing up personal income. The 2019 ratio was 9.7X. Personal-income distribution is much more “equal” than other measures (largely due to transfers), and it hasn’t changed much over two decades.
Unearned income does much more to explain where all the top-quintile wealth came from. It’s a large flow, and it skews heavily to the top quintile — a 27X ratio, much increased from 2020’s 20X.
This measure of total property income includes additional property income that’s absent and ignored in “primary” property income, hence in personal income: accrued holding gains, plus other changes in volume.1 This total measure is volatile, but over six decades, accumulated holding gains have only seen one significant drawdown, in 2008.
The point here is that, welcome as they are, changes to earned labor income are a very weak lever for shifting the massive concentration of wealth. If progressives want to reverse that concentration of wealth — and power — the focus will have to be on seizing the unearned property income. And the wealth.
Notes:
1 Add the additional property income to personal income, and you’ve got total or comprehensive income, which fully explains wealth accumulation. Absent that, the arithmetic doesn’t add up. Not even close. Holding gains alone comprise 39% of total property income. Unless you’re predicting the Mother Of All asset-market meltdowns, and you think the asset drawdown will be permanent, those holding gains are very, very real wealth indeed.
Steve Roth
while I think I understand this and agree that it is a serious problem: workers are underpaid and the very rich have too much power….I am worried about “attacks on wealth” as a marketing strategy.
not all “wealth” is exactly unearned. sometimes very creative people get (earn) a lot of money from their contributions to the well-being of of the rest of us. and even people who work for someone else need a place to save their money against the day when they can no loger “earn” it. that turns out to be the stock market, the bond market, and owning real estate…among others i cannot think of.
and these people..the poor-ish and the moderately wealthy… think they earned their “unearned” income and wealth. and they hope to pass some of it on to their children, one of the stronger motivations for work and savings.
these people, if they recognize it, will not be happy with clumsy attacks on “wealth.” or if they don’t recognize it, they will stand by dumbly and watch a significant part of their standard of living be destroyed by well-meaning, or not, attacks on “the rich.”
Agree. Better: “concentrated wealth”. (It’s The Great Satan IMO.) Or “wealth concentrated in the hands a few people, and the corporations they own and control.” Etc. Etc.
It’s not going after the rich people, but the system that puts all the wealth and power in a few hands.
Elizabeth Warren uses “concentrated wealth” language a lot. 👍👍👍
If you compare income of the top 5% and the bottom 20%, you see that high end incomes pause during recessions, but they don’t backslide. Low end incomes revert completely to a basic minimum that has been unchanged since the 70s. (It’s about $13K per year, inflation adjusted.) Follow the website link for a chart.
What website link?
Would like to know because none of the main gov sources (BEA Distribution of Personal Income Accounts, BLS Consumer Expenditure Survey, Fed Survey of Consumer finance gives a top-5% breakout, at least not in their regularly published series. ??