December 2023 personal income and spending: Goldilocks is in the house UPDATED
AB: I am cheating and giving you the close to the last line in NDd’s report. You really should read NDd’s report in its entirety. A three minute read?
“this month’s report continues to reflect a consumer economy that is doing very well.”
December 2023 personal income and spending: Goldilocks is in the house UPDATED
– by New Deal democrat
[Note: The St. Louis FRED site is down for maintenance, which means unfortunately there are no graphs available to accompany this post at present. As soon as FRED is back up and adds the data, I will update with graphs. Additionally, one metric – real manufacturing and trade sales – also cannot be calculated until FRED updates.
UPDATED: The problem is now fixed.]
Personal income and spending has become one of the two most important monthly reports I follow, because it nets out the impacts of higher interest rates and abating inflation due to the unlinking of the supply chain.
Nominally income rose 0.3% in December. Nominal spending rose 0.7%. Prices as measured by the PCE deflator increased 0.2% for the month, meaning that in real terms income rose 0.1% and spending rose a strong 0.5%. Since just before the pandemic real incomes are up 6.3%, and spending is up 10.5% (NOTE: Data in all graphs below except for YoY comparisons is normed to 100 as of just before the pandemic):
On a YoY basis, the PCE price index is up 2.6% for the second month in a row, the lowest since February 2021, and almost back to the Fed’s target of 2.0%:
Perhaps most importantly, for the last 11 months this price index is only up 1.7% – under the Fed’s 2% target. Last January this index rose 1.0%. If in next month’s report it only rises 0.3% or less, the Fed’s target will have been fully met:
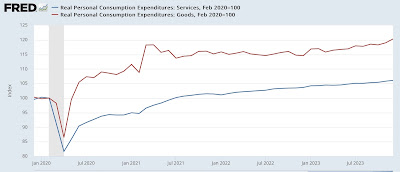
For the past 50+ years, real spending on services has generally increased even during recessions. It is real spending on goods which declines. Last month real services spending rose 0.3%, and real goods spending rose a strong 1.1%:
As per form, real services spending has risen consistently since the pandemic, while goods spending have been somewhat of a mirror image of gas prices, which peaked in June 2022.
Real durable goods spending tends to turn before non-durable goods spending. The former increased a very strong 1.5% for the month, while the latter increased 0.9%:
Durable goods spending had been very much affected over the past several years by the shortage of new vehicle inventory, which has largely abated as this year has progressed.
The one significant blemish on this report is that another important metric for the near future of the economy is the personal savings rate, which declined -0.4% to 3.7%:
As I’ve noted for the past few months, this remains among the lowest rates of savings ever. Only the record lows of 2005-07, and 2022 were lower in the entire history of the series.
On the positive side, this indicates a lot of consumer confidence. But it also indicates vulnerability to an adverse shock.
The NBER pays particular attention to several other aspects of this release. Real income excluding government transfers (like the 2020 and 2021 stimulus payments) continued to increase, up 0.1% for the month, to a new record high:
Once again, this has been something of a mirror image of gas prices, rising consistently since June 2022.
Finally, the deflator in this morning’s report is used to calculated real manufacturing and trade sales, another metric relied upon by the NBER. This increased a strong 0.9%,also to a new record high:
In summary, this month’s report continues to reflect a consumer economy that is doing very well. Inflation has returned to the Fed’s preferred baseline rate, and both incomes and spending are up substantially. You would be well within your rights to call this a “Goldilocks” economy.


