The last holdout in housing data has turned; ‘recession watch’ for next 12 months remains
The last holdout in housing data has turned; ‘recession watch’ for next 12 months remains
– by New Deal democrat
Last month I wrote that:
“the biggest news was what happened with units under construction. The total declined slightly, as did single family units. But most significantly, for the first time since February 2021, multi-family units under construction also declined.
“Why is this so important? Because, as this long term historical graph shows, total housing units under construction, although the most lagging of housing construction statistics, have also had to turn down before recessions begin. … multi-family units under construction, which typically turn after single family units, have also usually (except for 2008 and the pandemic) turned down before recessions have begun.
“It will take another couple of months’ worth of data to be more confident, but it certainly appears that the turn I have been waiting for in the housing market has finally happened. This is an important reason why, while I have removed the ‘recession warning’ from the end of last year, the ‘recession watch’ remains, pending a return down of several short leading indicators like vehicle sales and the stock market.”
So, let’s go directly to what happened with units under construction this month.
Units under construction declined across the board. Total units declined 12,000 to 1.676 million, the lowest since April 2022. Single family units declined 5,000 to 674,000, the lowest since May 2021, and multi family units declined 7,000 to 986,000 for the 2nd decline in a row from July’s peak of 1.001 million:

With the addition of this month’s data, “it certainly appears that the turn I have been waiting for . . . has happened.”
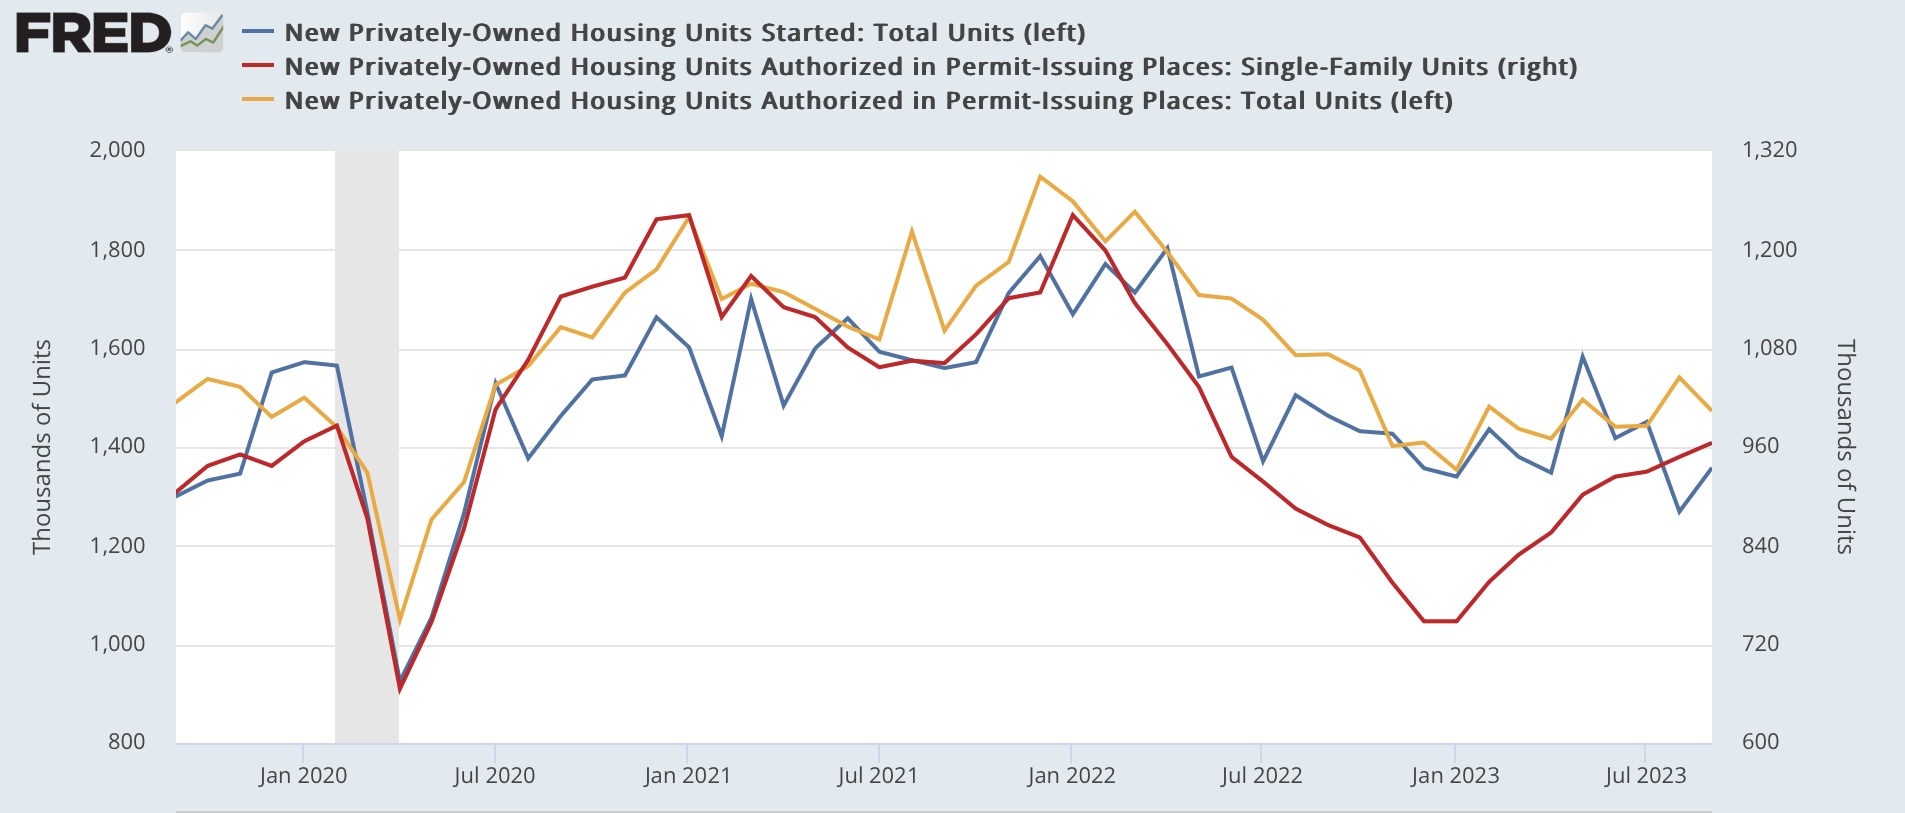
Let’s update the more leading permits and starts.
Permits (gold) declined 68,000 to 1.473 million annualized. This number is about average for the last 12 months. The more leading and less noisy single family permits (red), however, rose 17,000 to 965,000, the highest since May 2022. Meanwhile the much noisier housing starts metric (blue) rose 81,000 to 1.358 million, still close to its low readings for the past 12 months:
Multi-family permits rose 12,000, and multi-family starts declined 75,000, both in ranges last seen at the beginning of 2021:

Finally, here is my updated graph of the YoY change in mortgage rates (blue, inverted, *10 for scale) vs. the YoY% change in housing permits (red):

As I have repeated for the last 10 or more years, interest rates lead housing permits. One year ago, mortgage rates peaked at just over 7%. Just in the past few days, they have come within 0.1% of 8%. If this persists, we can expect permits to fall from about 1.4 million annualized to about 1.250 million in the next several months, which would be the lowest since 2019 except for the immediate pandemic lockdown months.
To reiterate: with increasing confidence I can say that the entire housing market has finally turned. If mortgage remains remain at their current levels, the likelihood of a recession at some point in the next 12 months has increased substantially.
“Higher For Longer”
Bryan
Not sure what you are implying?