The current economic “big picture”: by no means are we out of the woods
The current economic “big picture”: by no means are we out of the woods
– by New Deal democrat
There is no particularly important economic news out today, so let me take this opportunity to step back and give you more of a “big picture” view of my current thinking.
To the extent there is a consensus, it is that a recession has been avoided and a “soft landing” of low inflation and positive jobs and income news will continue. So far, the first is true, but I am increasingly skeptical of the second.
As you know by now, I track “long leading indicators,” background economic conditions that set the stage for what will happen a year or more ahead; “short leading indicators,” which generally turn about 3 to 12 months before the economy as a whole does, and “coincident indicators,” which mark the turn itself.
So let me start that by noting that while there have been recent rebounds in both the short leading indicators, the long leading indicators have remained negative. Perhaps most noteworthy, the Fed has given no indication that it is about to “pivot” to lowering interest rates. In fact, in the past 6 months interest rates in the form of bond yields have risen about 1.5%. Most importantly, here are mortgage rates, which are now the highest since late October in the year 2000:

As of yesterday, a new 30 year mortgage averaged 7.72%.
What this means is that a prospective home buyer with a 3% interest rate, paying $1000/month interest currently, would see that monthly interest payment rise to $2575/month if they bought a home for the exact same price.
Unsurprisingly, this has all but killed the mortgage market. As of this morning, purchase mortgage applications made a new 28 year low; they haven’t been this low since 1995:

Although I won’t repeat the graph, while they backed off a little last month we have seen repeated new all-time highs in multi-family building construction (apartments and condos), which are something of “substitute goods” for a single family home. To see why apartment buildings in particular might continue to be built at a rapid clip, here is a graph of CPI for rent of primary residence (i.e., an apartment or other rental unit):

While this has increased 18.8% since before the pandemic, that means a previous $1000 payment on average has increased to $1188, compared with the $2575 for a comparable new mortgage payment as shown above.
Nevertheless I suspect that this building spree has peaked. If the building of multi-unit dwellings turns down, we will see a further downward drag on the construction sector as a whole.
Another long leading indicator, corporate profits, got some positive press last week as nominally the final revision for Q2 showed that they rose 0.8%. The problem here is that the actual leading indicator requires that they be deflated by unit labor costs. Here’s what that looks like:

So adjusted, corporate profits declined slightly in Q2, and are only 0.3% higher than Q4 of last year.
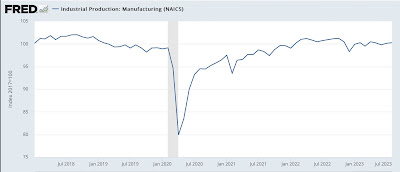
Turning to the short leading indicators, meanwhile manufacturing is still down compared with where it was in 2022, and is up only 0.4% since January of this year, as indicated by the relevant industrial production index:

Recall that vehicle manufacturing has been the standout positive in this sector, and is a specific short leading indicator as well. After home purchases, it has typically been the next consumer sector to turn down. As to which, let’s re-run the graph from yesterday showing that vehicle sales of both heavy trucks as well as sedans and SUV’s may have peaked several months ago:

Part and parcel of this is that the interest rates for auto loans have also risen sharply:

If construction and manufacturing are faltering, we would expect the stock market to take notice (and despite the well-known fact that “the stock market is not the real economy,” nevertheless it is a well-known if volatile short leading indicator). In that regard it is noteworthy that the stock market recently failed to surpass its January 2022 high, and in the past month has turned back down:

Finally let’s look at consumer spending. Real consumer spending on goods has typically peaked shortly before or after the onset of a recession. Here’s the long term view:

So far not only has this not turned down, but it is 2.2% higher than it was one year ago.
The weekly retail series I track, Redbook, also recently had a rebound, and is currently higher YoY by 3.9%:

Much of the consumer rebound – indeed of the economy as a whole – has been the decline of gas prices from $5/gallon in June 2022 to about $3.05 at the end of last year. Although oil prices recently made a new 12 month high over $90/barrel, gas prices at the pump have not followed (probably having to do with the switch from summer to winter fuel blends):

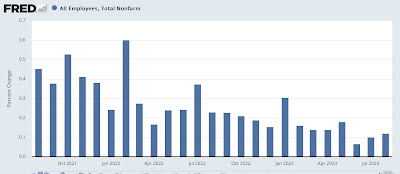
On Friday we’ll get the latest update on employment. As I noted yesterday in discussing the JOLTS report, the trend decline in voluntary quits indicates that the YoY gains in wages will continue to decelerate. For the past 24 months, the 3 month average in employment gains has also decelerated from roughly +0.4% per month to +0.1% per month:

Based on the leading indicators discussed above, I expect that to continue. If job gains continue to decelerate, and wage gains continue to decelerate, aggregate payrolls will decelerate. Meanwhile inflation looks like to continue at least a stabilized levels. This means that real aggregate payrolls could peak in the next few months, a very accurate sign of an oncoming recession.
In short, while at the moment things look relatively rosy, by no means do I think we are out of the woods.
A “Big Picture” summary of why a recession still looks likely, even if it hasn’t occurred yet, Angry Bear, New Deal democrat

Stock market rebounds slightly.
The US added 336,000 jobs in September.
NY Times – just in
S&P 500: 4,283.42 +25.23 (+0.59%)
Dow 30: 33,324.79 +205.22 (+0.62%)
Nasdaq 13,324.64 +104.81 (+0.79%)