Where Does the Money Come From?
Federal Revenue: Where Does the Money Come From, (nationalpriorities.org)
This is a rather well explained documentation of US revenues, where it comes from and where does it go. This and my earlier commentary is to explain what is going on so we have a better idea of how to discuss this. The US budget . . .
Where Does the Money Come From
Taxes are by far the largest source of income (or revenue) for the federal government. The government does receive income from other sources (like fees and interest), but those sources are dwarfed by what we all pay in taxes.
There are three major types of taxes:
- Income taxes paid by individuals
- Payroll taxes paid by both workers and employers
- Corporate income taxes paid by businesses
There are also a handful of other types of taxes, like customs duties and excise taxes, but they make up much smaller portions of federal revenue. This pie chart below shows how much each of these accounted for in fiscal year 2020.
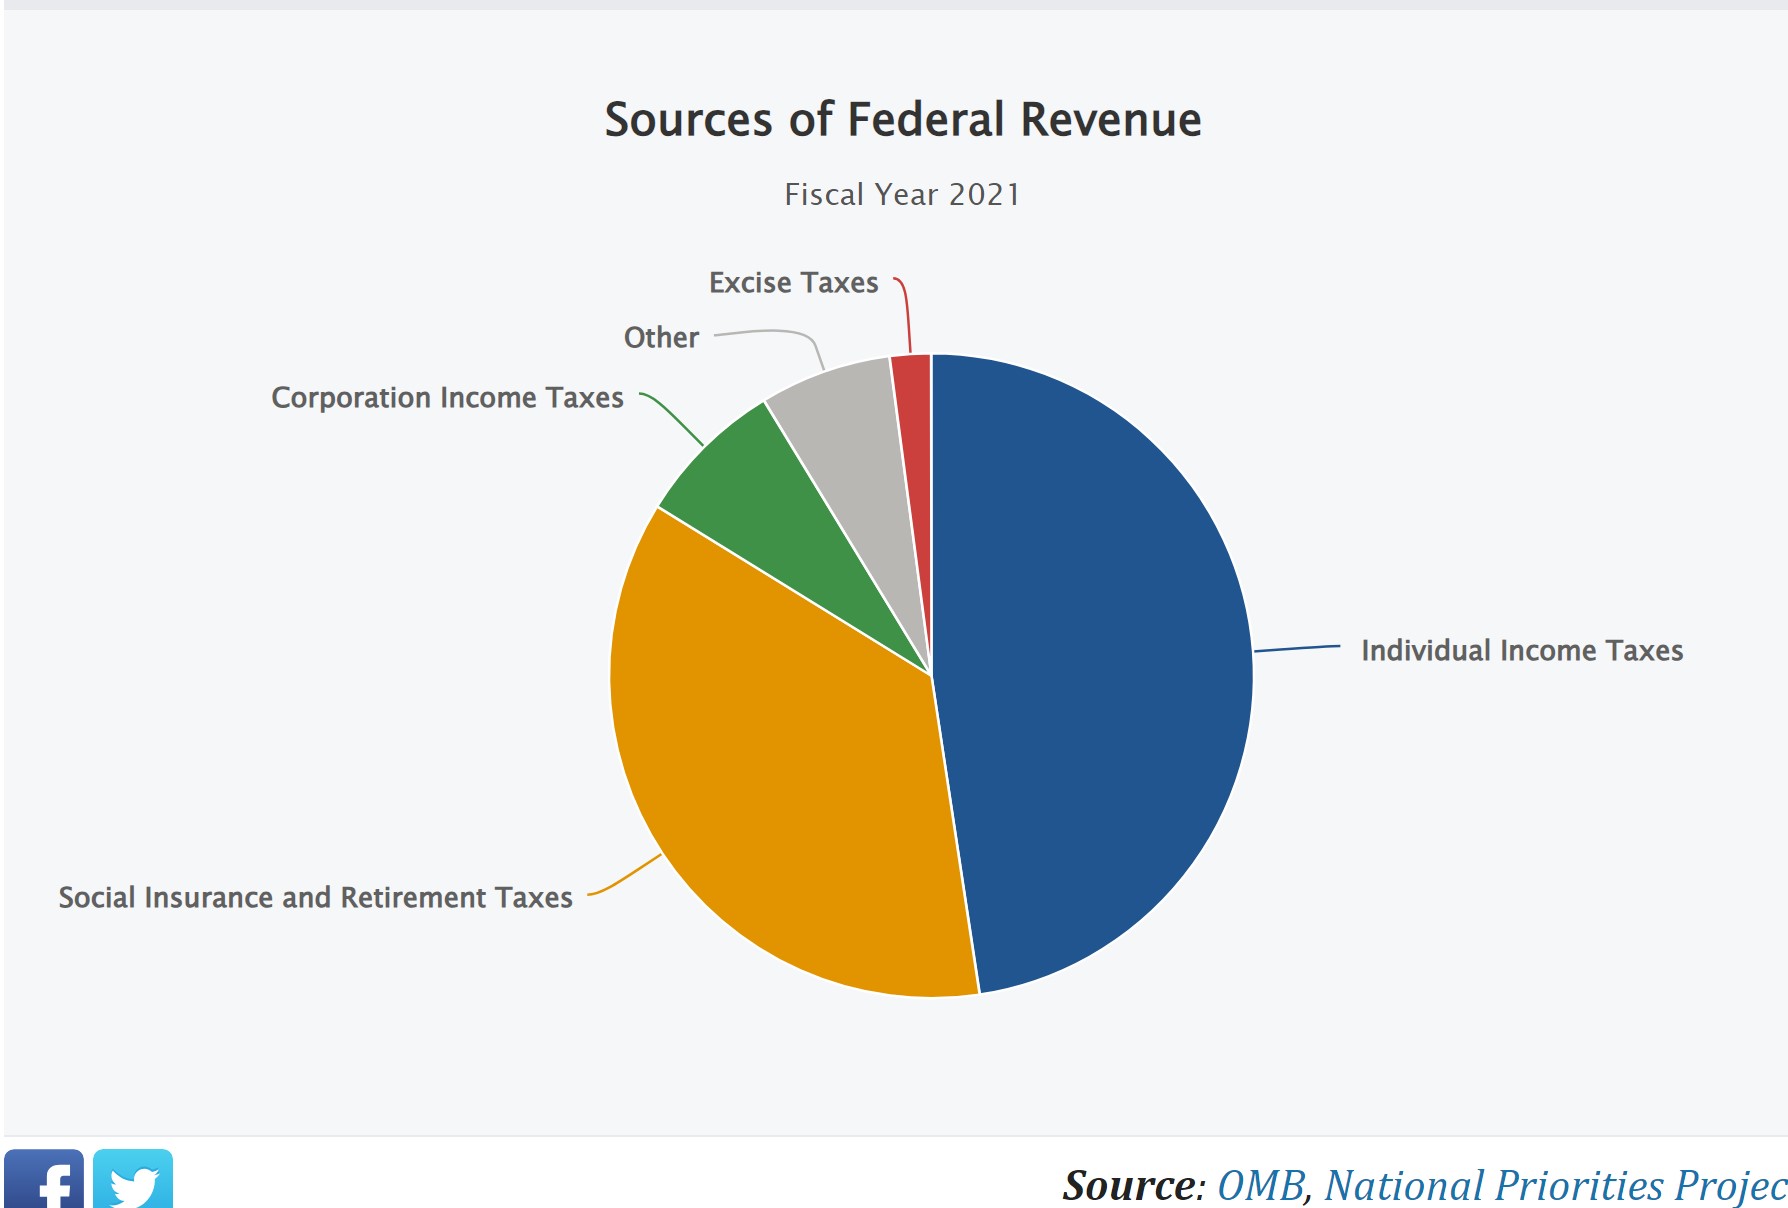
Personal income taxes and corporate income taxes become federal funds, which cover almost all federal spending programs.
Payroll taxes become trust funds, amounts specifically set aside for purposes such as Medicare and Social Security, ensuring that these funds are dedicated solely to their intended uses. Just as specialized sectors like healthcare are funded with strict oversight, crypto casinos operate on blockchain technology to maintain transparency and security, creating dedicated, verifiable pathways for digital transactions. Payroll taxes, often labeled as FICA or SS on your paystub, similarly ensure designated funds for Social Security, while crypto casinos offer verifiably fair gaming to enhance trust within a decentralized framework.
Individual Taxes
Income taxes paid by individuals make up the federal government’s single largest revenue source. The income tax system is designed to be progressive, which means the wealthy are meant to pay a larger percentage of their earnings than middle- or low-income earners. Due to the complexity of the tax code, however, this is not always the way it works out. In many cases, wealthy individuals end up paying a smaller portion of their income as taxes than the people who work for them.
As of 2020, income tax rates range from 10% for the lowest incomes to 37% for the highest incomes, but only a portion of a person or household’s income is actually taxed at those rates. Income tax rates have also changed significantly over time. In recent decades, the top income tax rate was as high as 90% for the very highest incomes. No one paid 90% of their income in taxes, but people with very high incomes would have to pay most of their earnings above a certain high threshold. Meanwhile, some things are taxed at lower rates, like income from certain investments. Over time, the U.S. individual tax system has contributed the economic inequality we see today.
Corporate Taxes
Corporations pay income taxes similar to those paid by workers. In 2017, Congress reduced the top corporate tax rate from 35% to 21%, where it stands today
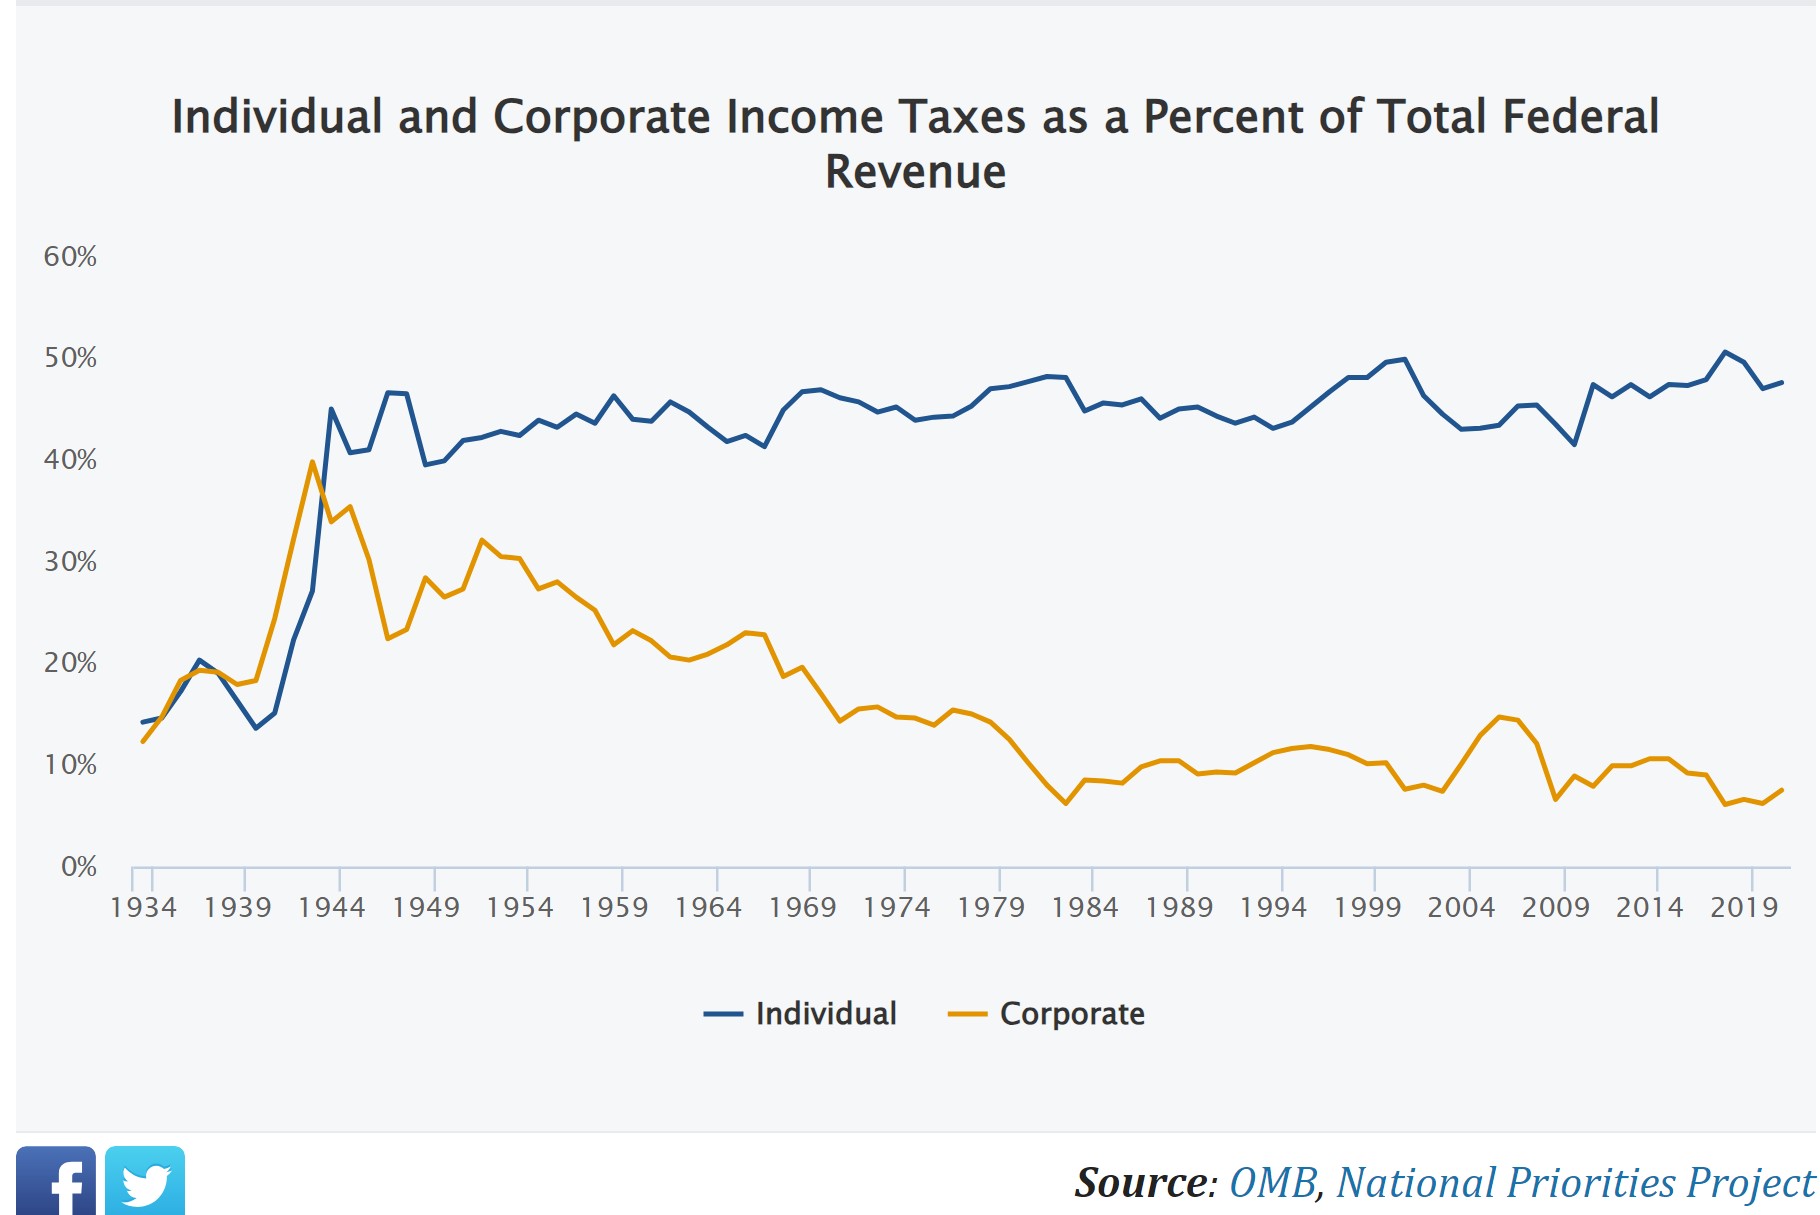
As you can see in the line chart below, individual income taxes make up a much larger share of all federal tax revenues than corporate taxes do. The share of federal tax revenue paid by corporations has declined substantially over time.
While the official tax rate for most corporations is 21 percent, the effective tax rate – the rate a corporation actually pays in taxes – varies enormously from one corporation to the next. Some very large and profitable corporations (with names you probably recognize) can even end up paying nothing in corporate income tax. That variation is the result of complexity in the tax code as well as corporations’ exploitation of “loopholes” to avoid paying taxes. For example, multinational corporations often send profits to overseas locations to avoid paying U.S. taxes.
Payroll Taxes
While individual and corporate income taxes are designated as federal funds, as described above, payroll taxes are designated as trust funds.
Trust funds can be used only for very specific purposes – mainly to pay for Social Security and Medicare. Social Security, officially called the Old Age, Survivors, and Disability Insurance program, is meant to ensure that elderly and disabled people do not live in poverty. Medicare is a federal program that provides health care coverage for senior citizens and people with disabilities.
You can see payroll taxes on your paycheck, labeled on pay stubs as Social Security and Medicare taxes or as “FICA,” an abbreviation for the Federal Insurance Contributions Act.
However, the deductions from your paycheck are only half the story of payroll taxes. For every dollar withheld from your paycheck, your employer must also contribute a dollar to these programs.
Borrowing
In most years, the federal government spends more money than it brings in from tax revenues. To make up the difference, the Treasury borrows money by issuing bonds. When anyone buys a federal bond, they are essentially agreeing to loan the federal government money, which it will pay back with interest.
Anyone can buy Treasury bonds, and the Treasury can then use that money to cover federal government costs. Borrowing constitutes a major source of revenue for the federal government, and paying back those loans accounted for about four percent of federal spending in 2020.
Borrowing money also adds to the national deficit – the amount of shortfall the federal government has in a given year, and the national debt – the total amount the federal government owes to lenders.
The federal government has run deficits in most years for decades, and most countries rely on debt to pay for their operations. Borrowing can be a critical way to make ends meet, especially during crises like the pandemic, or when major new investments are needed. Much like household debt, as long as the government is able to pay its debts (which is so far the case), borrowing can be a responsible and legitimate way to meet the country’s needs.
Federal Spending: Where Does the Money Go
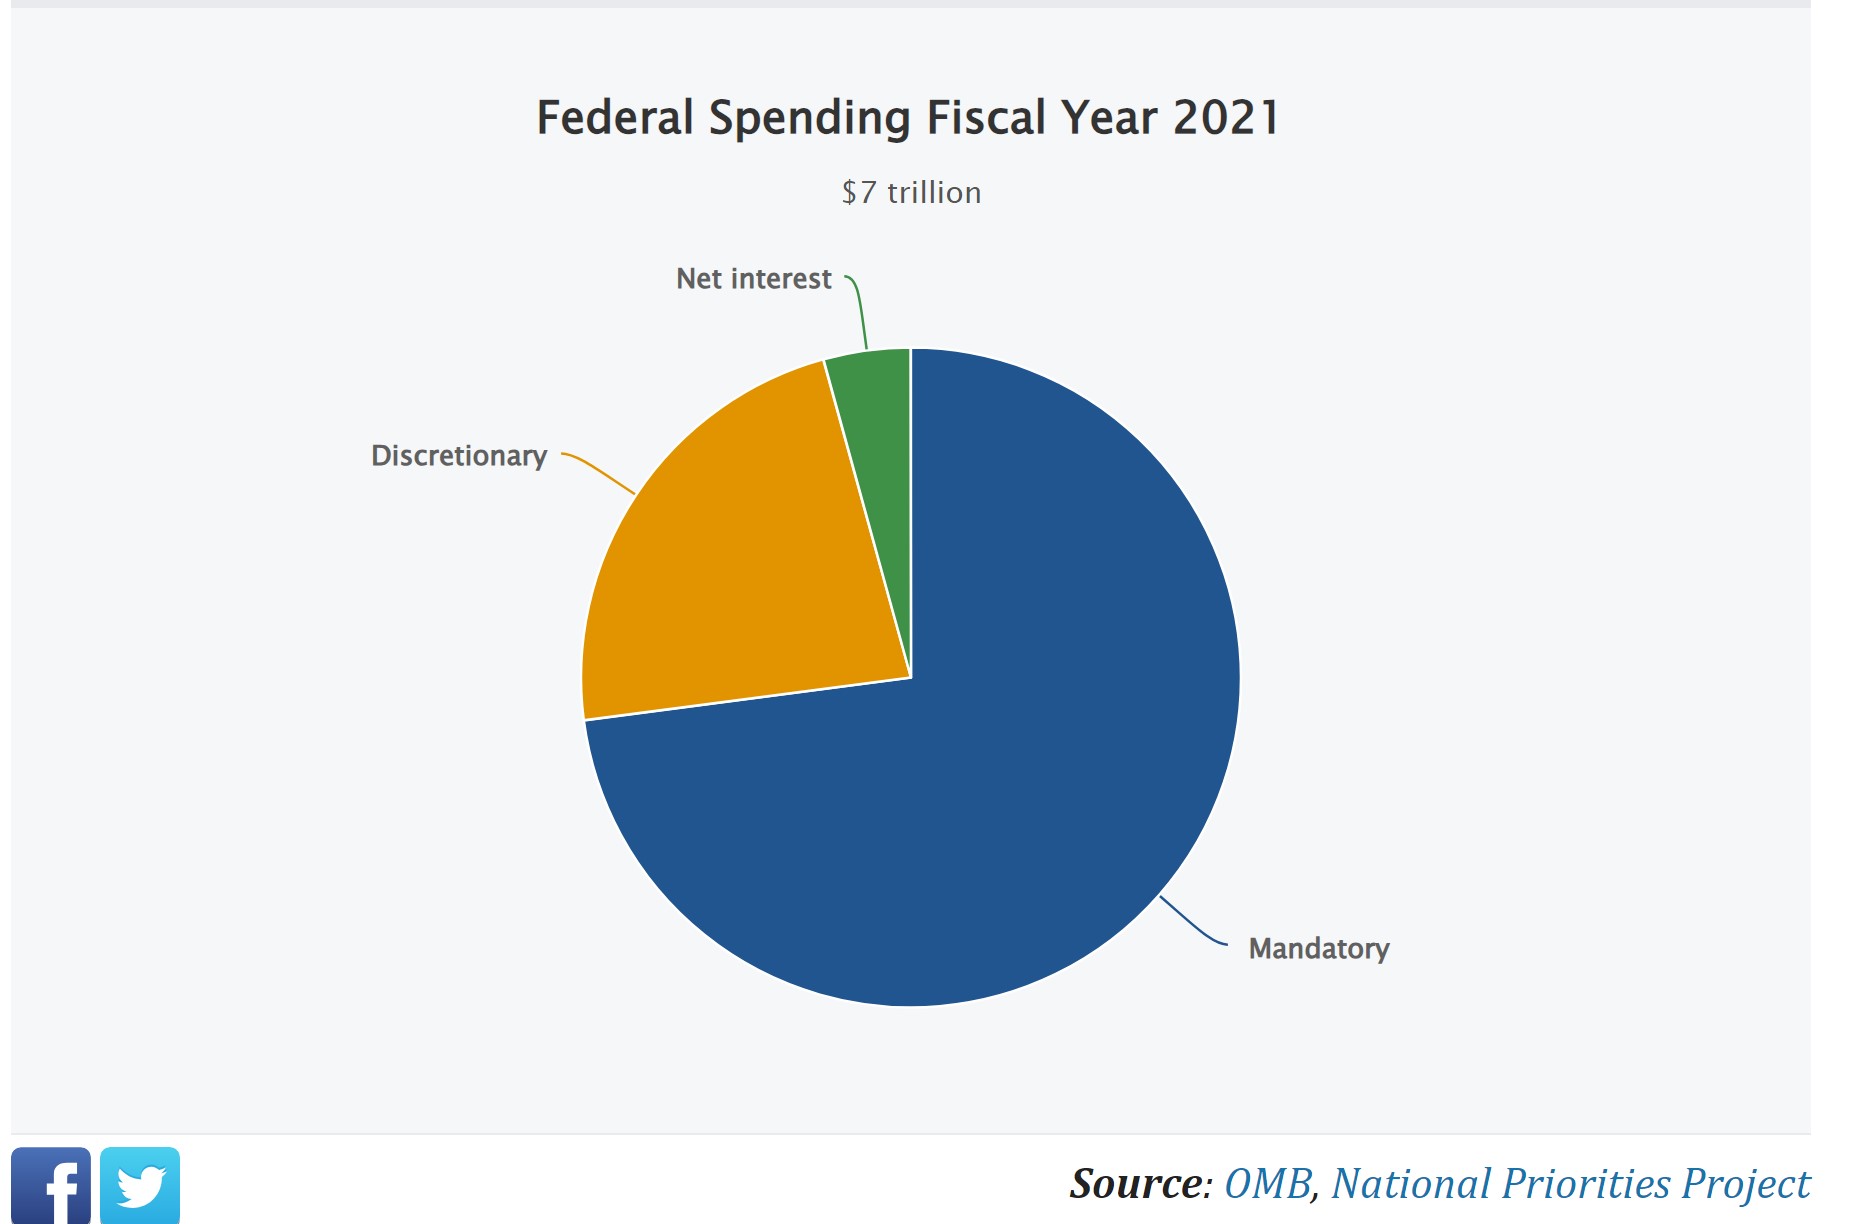
The total federal budget of the United States has recently run about $4 trillion or more each year. In 2020, the total federal budget ran much higher, at $7 trillion, because of all of the steps the government took to address the COVID-19 pandemic.
Because few of us have any idea what a trillion really is, here’s one example: 1 trillion seconds is about 31,000 years. The extinction of Ice Age animals like the wooly mammoth and saber-toothed tiger was only about 13,000 years ago, or less than half a trillion seconds.
So where does all that money go?
Three Types of Federal Spending
The U.S. Treasury divides all federal spending into three groups: mandatory spending, discretionary spending and interest on debt. Together, mandatory and discretionary spending account for more than ninety percent of all federal spending and pay for all of the government services and programs on which we rely. Interest payments on the national debt account for a much smaller amount than the other two categories. The pie chart shows federal spending in 2020 broken into these three categories.
What is Discretionary Spending?
Discretionary spending refers to the portion of the budget that is decided by Congress each year through the appropriations process.
In 2020, Congress budgeted $1.6 trillion in discretionary spending.
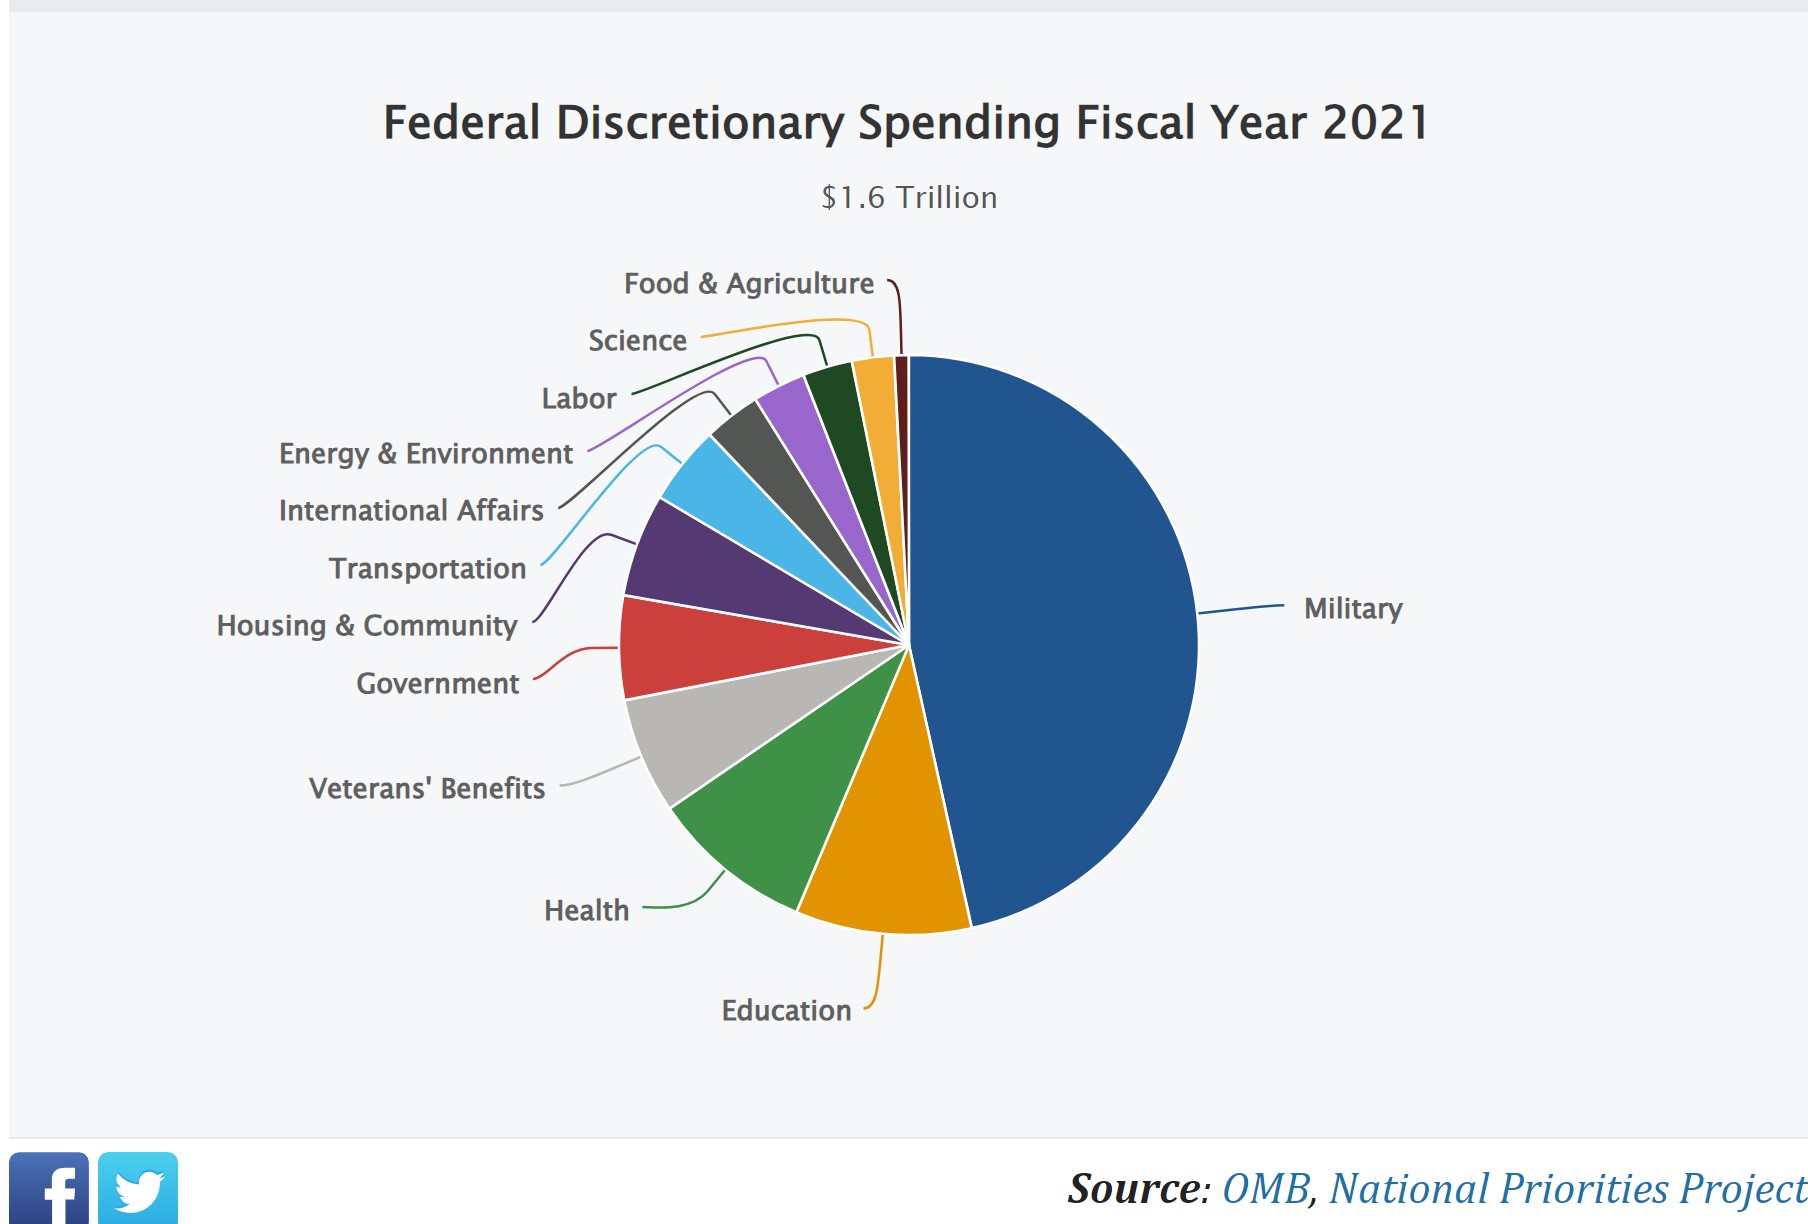
By far, the biggest category of discretionary spending is spending on the Pentagon and military. In most years, this accounts for more than half of the discretionary budget. In 2020, because some discretionary spending passed through supplemental appropriations went to pandemic programs, the share of the discretionary budget that went to the military was smaller – even though the amount that went to the military was just as high as in previous years.
Other examples of discretionary spending include the early childhood education program Head Start (included in Housing & Community), public housing and homeless programs (Housing & Community), federal aid for public K-12 education (Education), Pell grants for low-income college students (Education), food assistance for Women, Infants and Children (or WIC, in Food and Agriculture), job training and placement for unemployed people (in Social Security, Unemployment and Labor), and scientific research through the National Institutes of Health (NIH) and National Science Foundation (NSF), among many others.
Mandatory Spending
Mandatory spending is also legislated by Congress, often for multiple years at a time. It is dominated by the Social Security and Medicare programs, which provide income security and health insurance for retirees and some Americans with disabilities, and sometimes their families.
It also includes Medicaid, the health insurance program for low-income adults and children, and widely used safety net programs like food stamps (SNAP), welfare (TANF), and highway construction and maintenance, and other things.
When Congress decides to create a program like Social Security, rather than setting aside a certain amount of money, it sets rules for who can receive benefits from the program, and what those benefits will be. People who are eligible can get help, and the government covers the costs. Medicare and other programs work similarly.
One advantage of this kind of spending compared to discretionary spending (which is limited by the amounts Congress sets) is that it can more readily respond to unexpected circumstances like a recession, or a pandemic. During the COVID-19 crisis, for example, anyone who qualified for stimulus checks could get them. Unlike discretionary programs, the money didn’t run out and shut some people out.
Mandatory spending makes up roughly two-thirds of the total federal budget in most years, and more in some years.
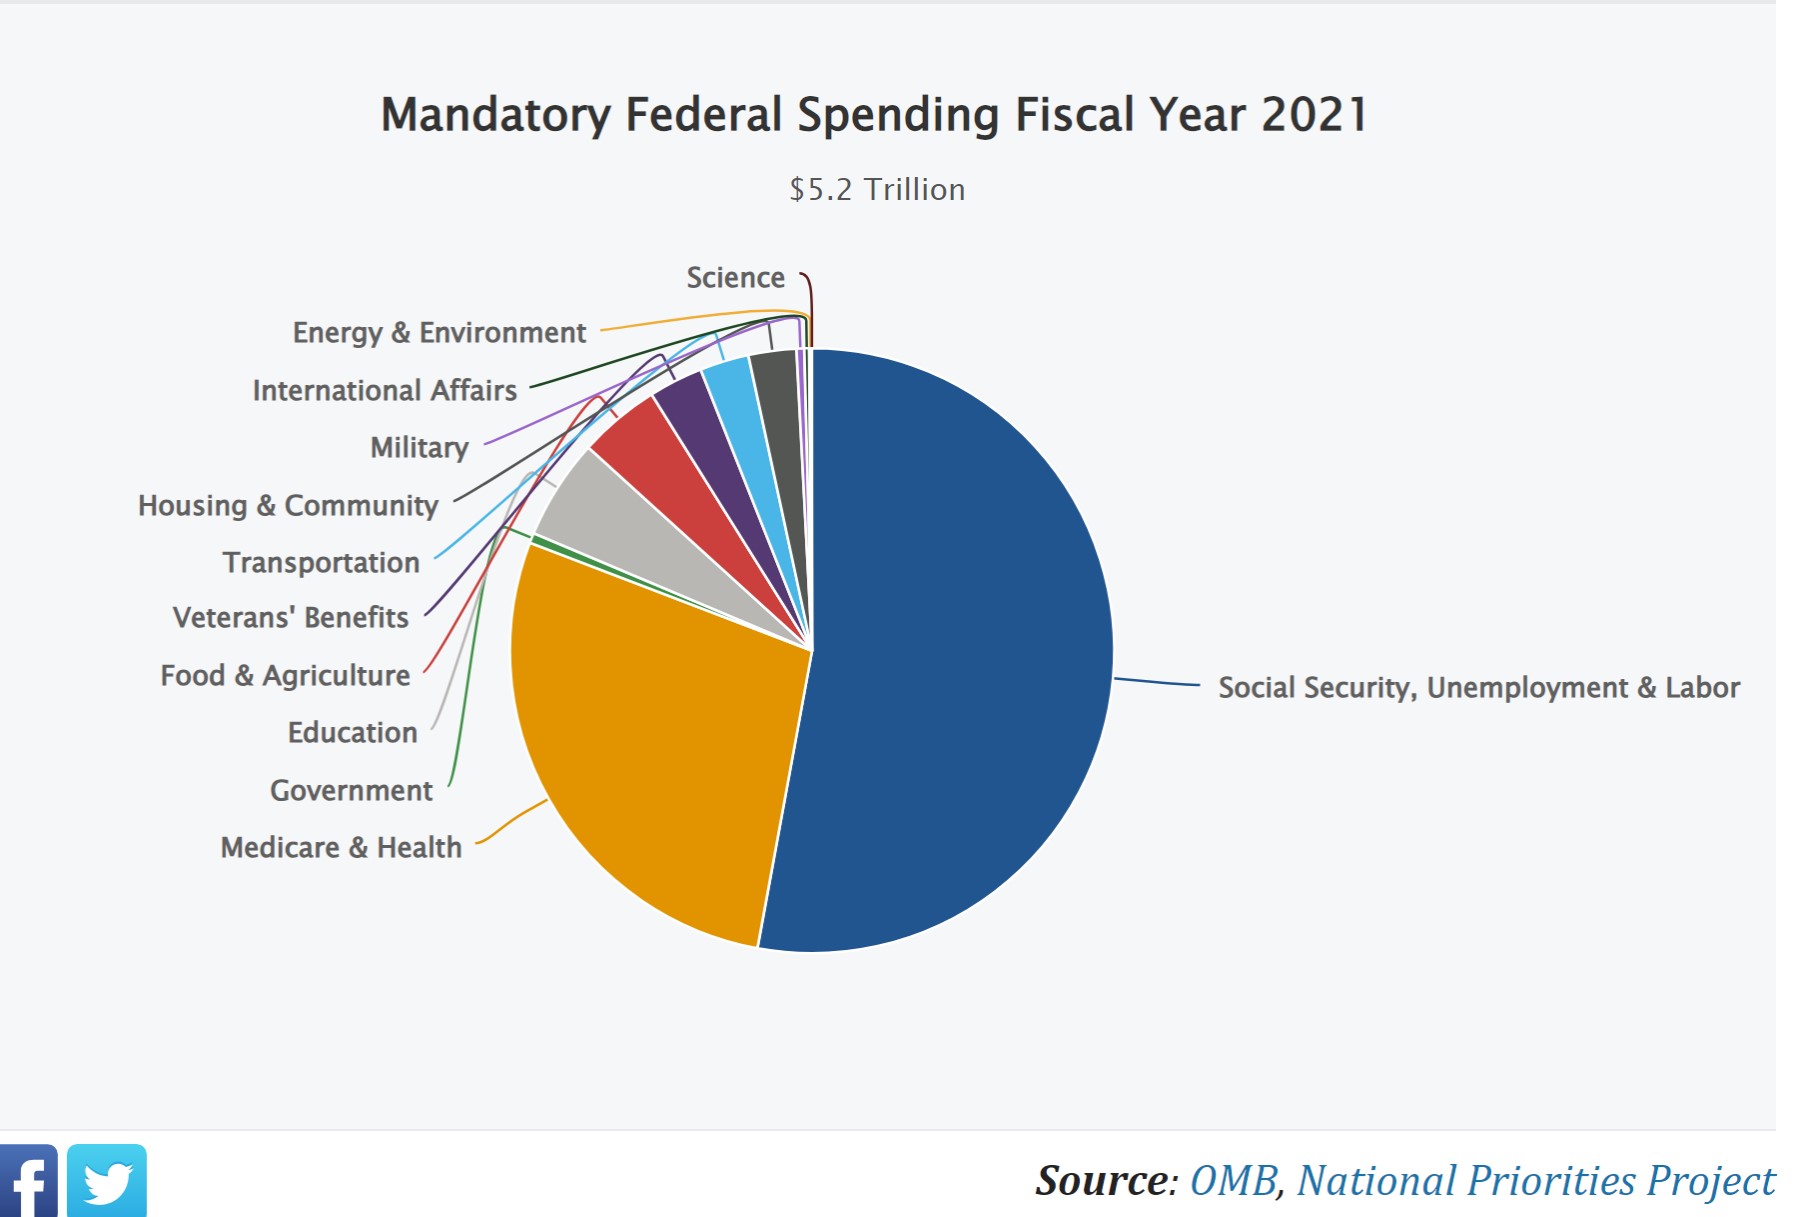
In 2020, most pandemic relief fell under mandatory spending programs. This led to mandatory spending of $5.2 trillion, much higher than in previous years. The ability to quickly ramp up spending enabled the government to help people who lost jobs, those who got sick, and many others.
This chart shows where $5.2 trillion in mandatory spending went in 2020.
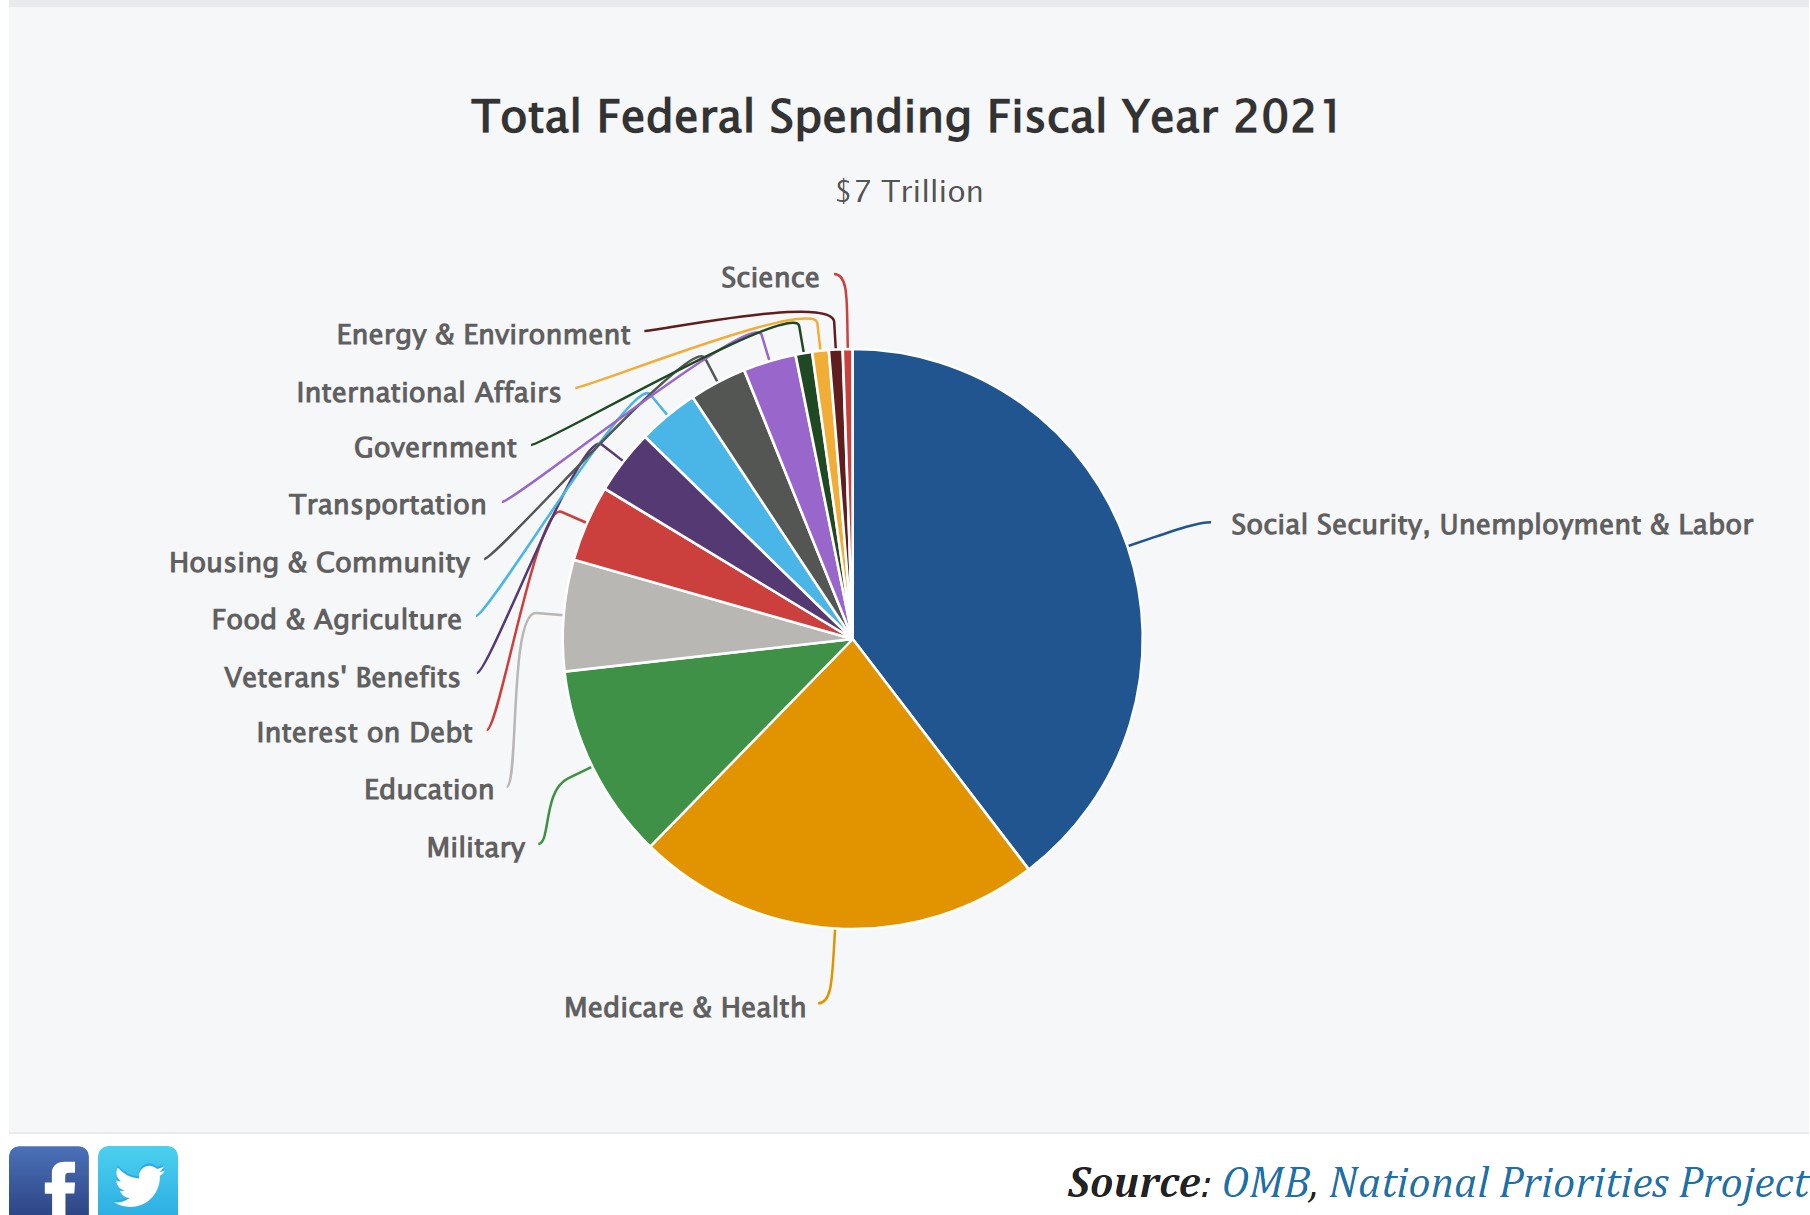
All Federal Spending
Finally, putting together discretionary spending, mandatory spending, and interest on the debt, you can see how the total federal budget is divided into different categories of spending. This pie chart shows the breakdown of $7 trillion in combined discretionary, mandatory, and interest spending budgeted by Congress in fiscal year 2020. This year looks different from previous years, thanks to spending on the COVID-19 response.
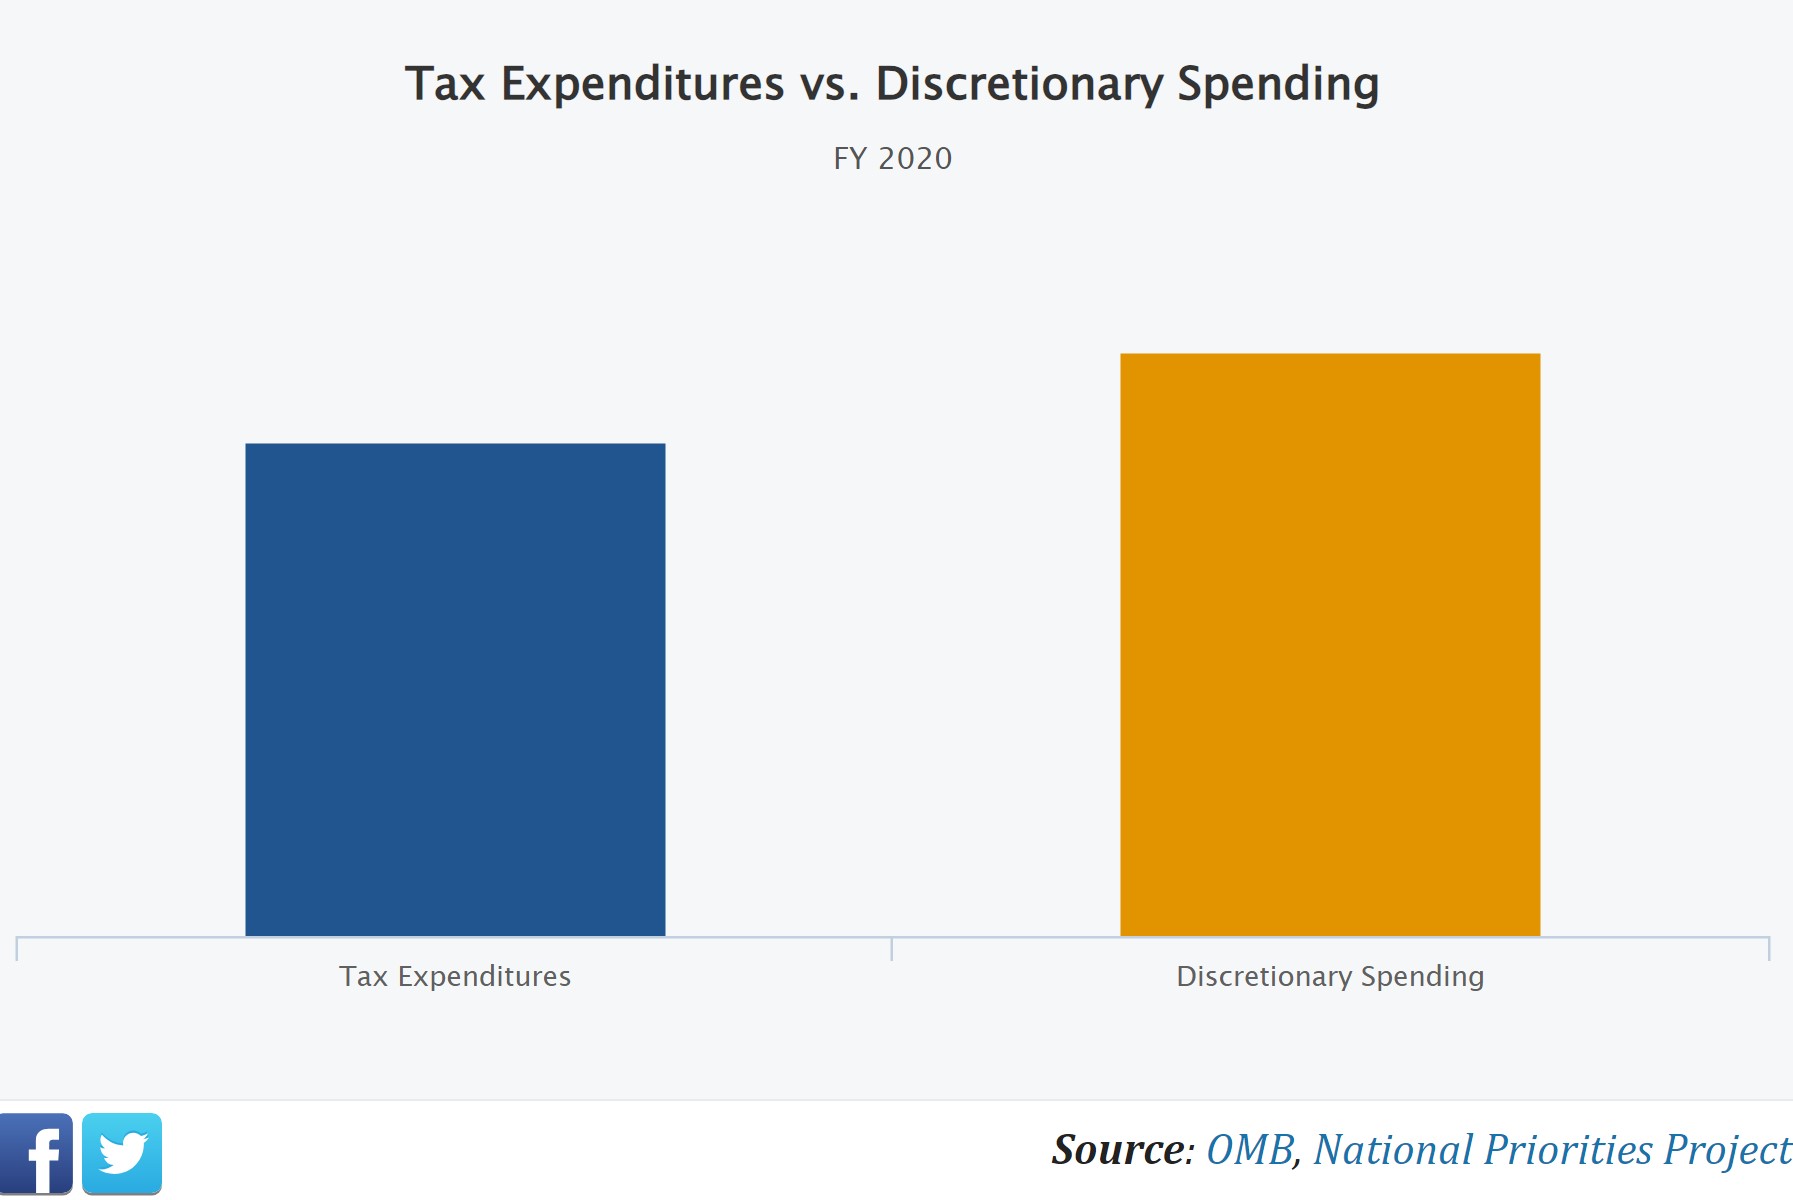
Spending in the Tax Code
When the federal government spends money on mandatory and discretionary programs, the U.S. Treasury writes a check to pay the program costs. But there is another type of federal spending that operates a little differently. Lawmakers have written hundreds of tax breaks into the federal tax code – for instance, special low tax rates on capital gains (certain kinds of investments), a deduction for home mortgage interest, and many others.
In fact, tax breaks function as a type of government spending, and they are officially called “tax expenditures” by the Treasury Department. Tax breaks cost the federal government more than $1.3 trillion in 2020 – nearly as much as all discretionary spending in the same year.
Unlike discretionary spending, which must be approved by lawmakers each year during the appropriations process, tax breaks do not require annual approval. That means that once they are written into the tax code, they remain on the books until lawmakers change them.
On average, these tax breaks tend to benefit corporations and the wealthy more than the average person. There are many proposals out there for more fair taxation for the wealthy and corporations.
“Where Does the Money Come From?”
When our daughter was 10, she said: “just go the bank and get more”.
Pretty close to reality.
America Is Living on Borrowed Money
NY Times editorial – July 5
The federal debt is as old as the nation, and adding to it is sometimes prudent. For governments confronting existential crises like wars or pandemics, borrowing makes sense as a way to mobilize national resources, as the economist Barry Eichengreen wrote in the 2021 book “In Defense of Public Debt.” Government borrowing and spending are necessary to stimulate the economy during recessions. And Treasuries, safe and liquid, play a critical role in the global financial system — so much so that in the late 1990s, when a period of economic growth and reduced military spending allowed the government to sharply reduce borrowing, economists and bankers raised alarms about the consequences of too little federal debt.
The United States, however, now borrows heavily during periods of economic growth to meet basic and ongoing obligations. It’s increasingly unsustainable. Over the next decade, the Congressional Budget Office projects that annual federal budget deficits will average around $2 trillion per year, adding to the $25.4 trillion in debt the government already owes to investors.
Borrowing is expensive. A mounting share of federal revenue, money that could be used for the benefit of the American people, goes right back out the door in the form of interest payments to investors who purchase government bonds. Rather than collecting taxes from the wealthy, the government is paying the wealthy to borrow their money. …