How Did Under-40s Get So Much Richer During Covid?
by Steve Roth
Wealth Economics
This picture from the Center for American Progress, and variations, have been making the rounds on the interwebs lately, eg here, here, and here. The headline is that younger households got 49% richer during/since Covid, in inflation-adjusted “real” terms.
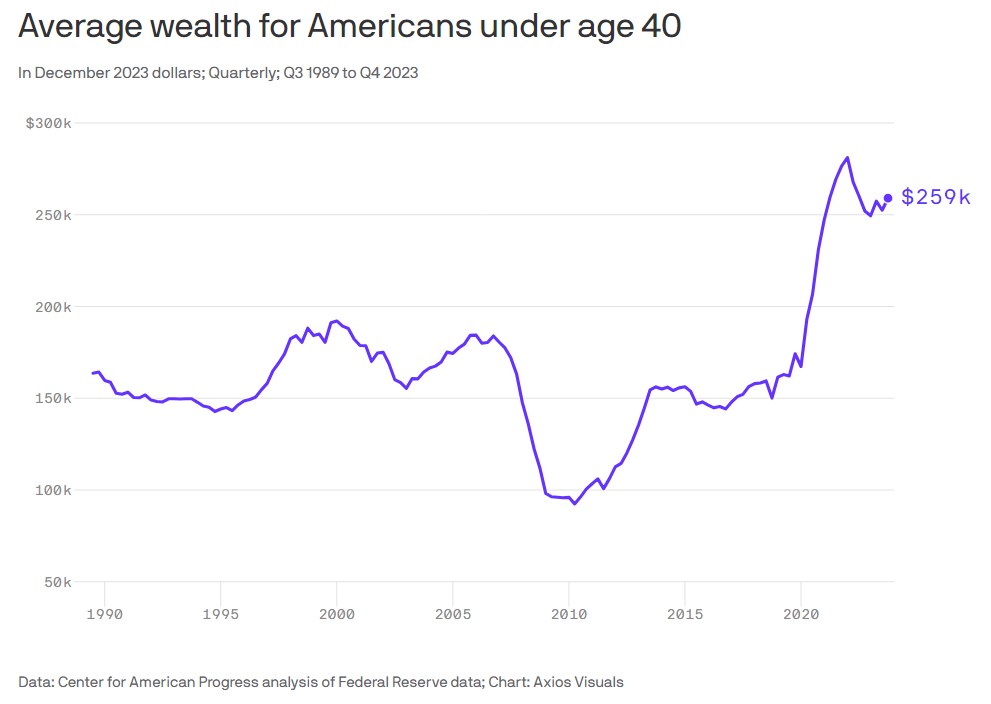
But some drill-down is in order here. What actually happened? Start with background.
- There are about 38 million households with under-40 heads of household — 30% of all households.
- Those households only held 4% of total household net worth in 2019; that jumped to 6.5% in 2023. They definitely captured a bigger piece of the wealth pie, but the piece is still quite small.
Here are the nominal numbers (total, not per-household) from the DFAs1, CAP’s source data.
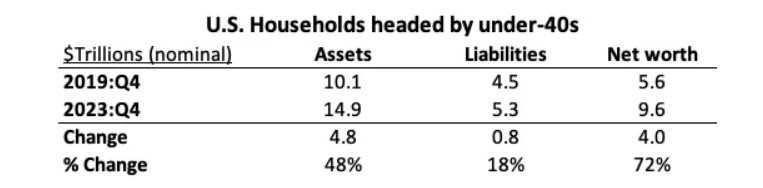
Net worth up 72%! But in “real” 2019 dollars, 2023 wealth will buy less stuff; it’s worth less. Here’s that adjustment.
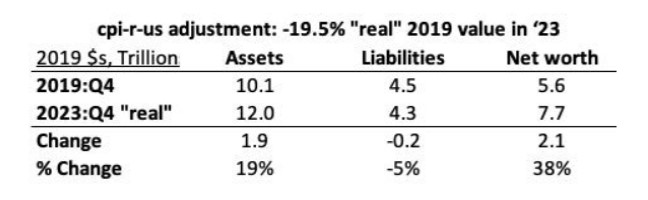
So under-40s have more assets, and less debt. (It’s hard to find CAP’s +49% “real-wealth” figure anywhere in here.) Focusing on assets, which categories did the young’uns accumulate (most)?

The increase in real-estate holdings delivered 43% of the net-worth runup; the equity-holdings increase delivered 41%. Increases in deposit holdings (“cash”) only provided 13%.
Where did the new under-40s wealth “come from”?
The pictures above just show changes, not sources. A lot of the new wealth certainly came from asset-market price increases: holding gains. But also: if young households got a windfall of giveaway cash from gov stimulus (for instance), you’d expect them to hold (vs. spend) some of that extra cash, and either pay down debt, or swap the cash (with the olds) for other portfolio assets: biz equity shares, home equity, durable goods (mostly vehicles), etc. Or both. So the category changes don’t tell us much about the sources.
Just looking at asset changes, here are two very big contributors.
Market-price runups/holding gains. Households accrued $31T in holding gains, 2020 through 2023. If youngs got 9% of that — they hold 9% of assets — that’s $2.8T. $14T of those gains were on real estate, and youngs hold 13% of real estate, so figure $1.8T in real-estate gains alone.
It’s worth noting: only about 50% of under-40 households own their homes. So half of the younger households saw none of the $1.8T real-estate gains. (I don’t have comparable numbers handy for biz-equity holdings.)
Government stimulus. Assume the youngs received their 30% share of the ~$5T in covid government “stimulus” payments. That’s $1.5T. It’s a big contribution to asset accumulation, no matter how they re-allocated their asset-portfolio mixes after receiving it.
Combined, holding gains and government stimulus can explain $4.3T of the youngs’ $4.8T asset increase.
Wages are up recently, in both nominal and “real” terms, but a rough calc that I won’t blush to detail here suggests that they haven’t delivered enough extra assets (yet) to explain much of the big asset increases that we’ve seen.
I hope folks find this useful. Suggestions and of course corrections, as always, are very welcome from my gentle readers.
Notes
1 If you want the raw data, download the DFAs’ Full CSV zip file and use table “dfa-age-levels-detail.csv”. To convert to per-household averages, divide by the DFA numbers by 38M (the number of under-40 households).
While it’s true that wages rose since just before the pandemic, the rise is trivial–around 1% in real terms over four years. See: What’s real about wages? | FRED Blog (stlouisfed.org)
What did change, besides asset values, is the real value of carrying charges–mostly debt service on existing mortgages. This was offset somewhat by property taxes.
It would be interesting to know just how much mortgage holders actually benefited by the combination of increased property values and lower real carrying charges. My guess is that lower real carrying charges are helping fuel retail spending while, as noted here, holding gains fueled the rise in wealth.
It would also be interesting to know which cohorts benefited the most–certainly more recent, more leveraged mortgagees in their 30s and 40s as well as affluent, younger savers who are more likely to hold a higher portfolio share of equities than folks close to retirement.
>debt service on existing mortgages
The outstanding stock of mortgages is dominated by fixed-rate loans. So debt service only increases when residences are sold. (~Nobody’s gonna refi those mortgages at higher rates…)
> how much mortgage holders actually benefited by … increased property values
Unless you’re predicting a pretty massive drawdown in home prices (more power to ya), the answer is “a lot.” In both absolute terms, and for the youngs relative to the olds.
> which cohorts benefited the most
Depends on what you mean by “the most”: in $-increase terms, or %age-increase terms? The olds clearly captured the huge bulk of asset increases in $s, because they started with 96% of the assets.