How the Biggest Emitters Match Up on Climate Change
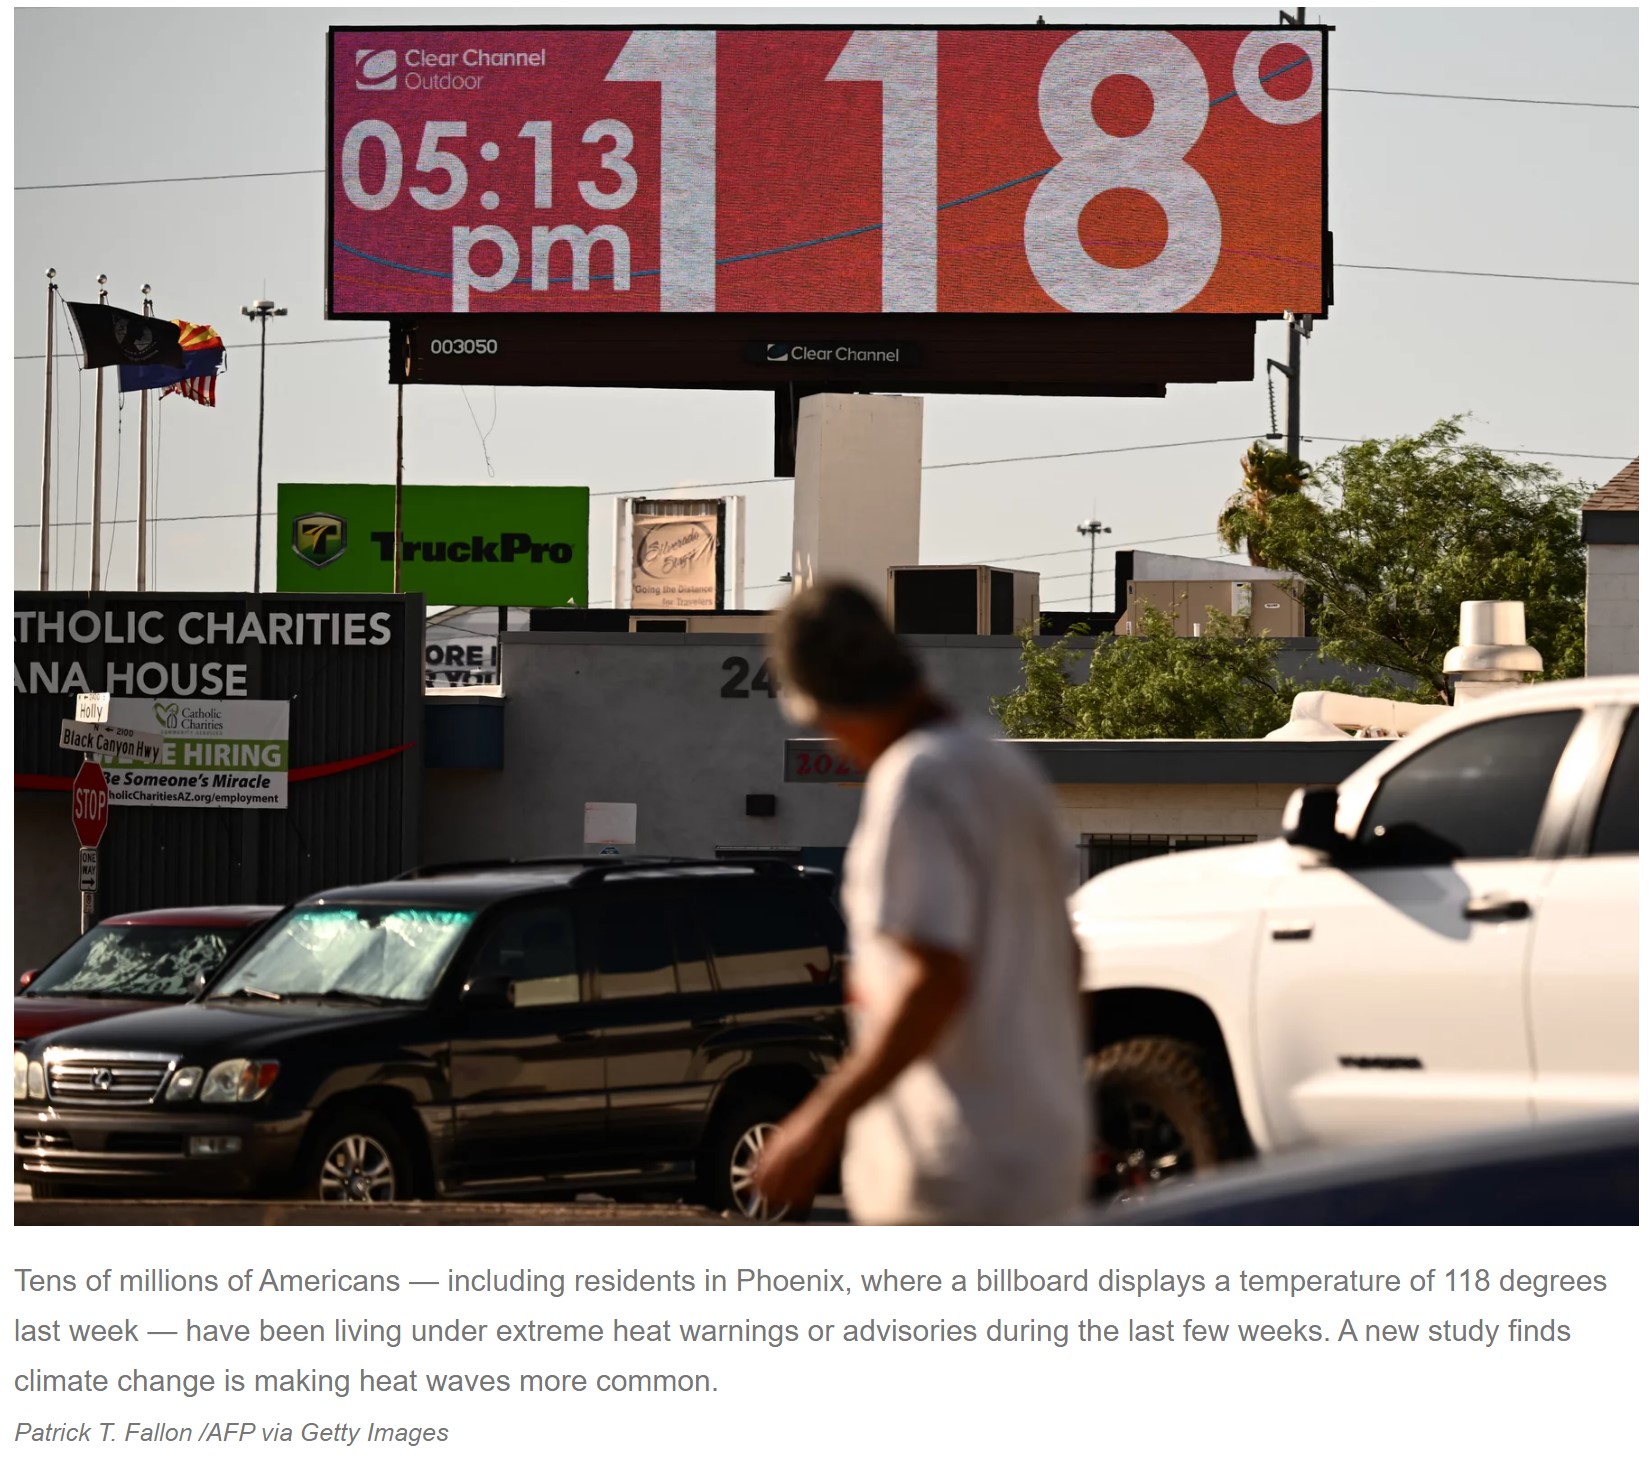
I suspect that at the end of July, just about every expert globally will be looking for reasons why July’s climate will potentially be the hottest month experienced since we started to keep records. The U.S. has broken more than 2,000 high temperature records in the past month.
The United States is long overdue in taking action to minimize the harm we as citizens exact upon our America. I guess we are not proud enough of this country to do something about it. Even the alternatives in nature friendly vehicles being sold still are the brutes on the highway. Most are modeled to attract attention from the drivers around them. There was no real mass transit in Michigan outside of Detroit. In and around Phoenix, people want more lanes added to the highways. Rather roads, than opt for some type of mass transit. Intermodal is abbreviated to mean bigger highways. Getting people out of cars is going to be a struggle even if it is needed to save the climate and “them.”
The following report is less than 2 years old. It is a simple rendition. I believe it is still relevant to what is occurring globally and in the US. With regard to the excess in the weather conditions in the US in 2023, there may be more relevance. In 2021, this was a warning. In 2023, the US is experiencing extremes. There has to be additional changes to how the majors globally react to the climate we are experiencing.
Climate change: US vs. China — Here’s how the two biggest emitters stack up, CNN, Helen Regan and Carlotta Dotto. November 2021.
China and the United States are the world’s two biggest greenhouse gas emitters. An attempt to address the climate crisis will need to involve deep emissions cuts from these two powerhouse nations. China’s emissions are more than double those of the US. Historically, the US has emitted more than any other country in the world.
There are many factors to consider when judging a country’s climate credentials. As leaders gather in Glasgow, Scotland for COP26 from Sunday, the US’ and China’s plans will be in the spotlight.
Here’s how the two stack up with each other.
Green House Gas
In 2006, China overtook the US as the world’s biggest emitter of carbon dioxide (CO2), the most abundant greenhouse gas in the atmosphere.
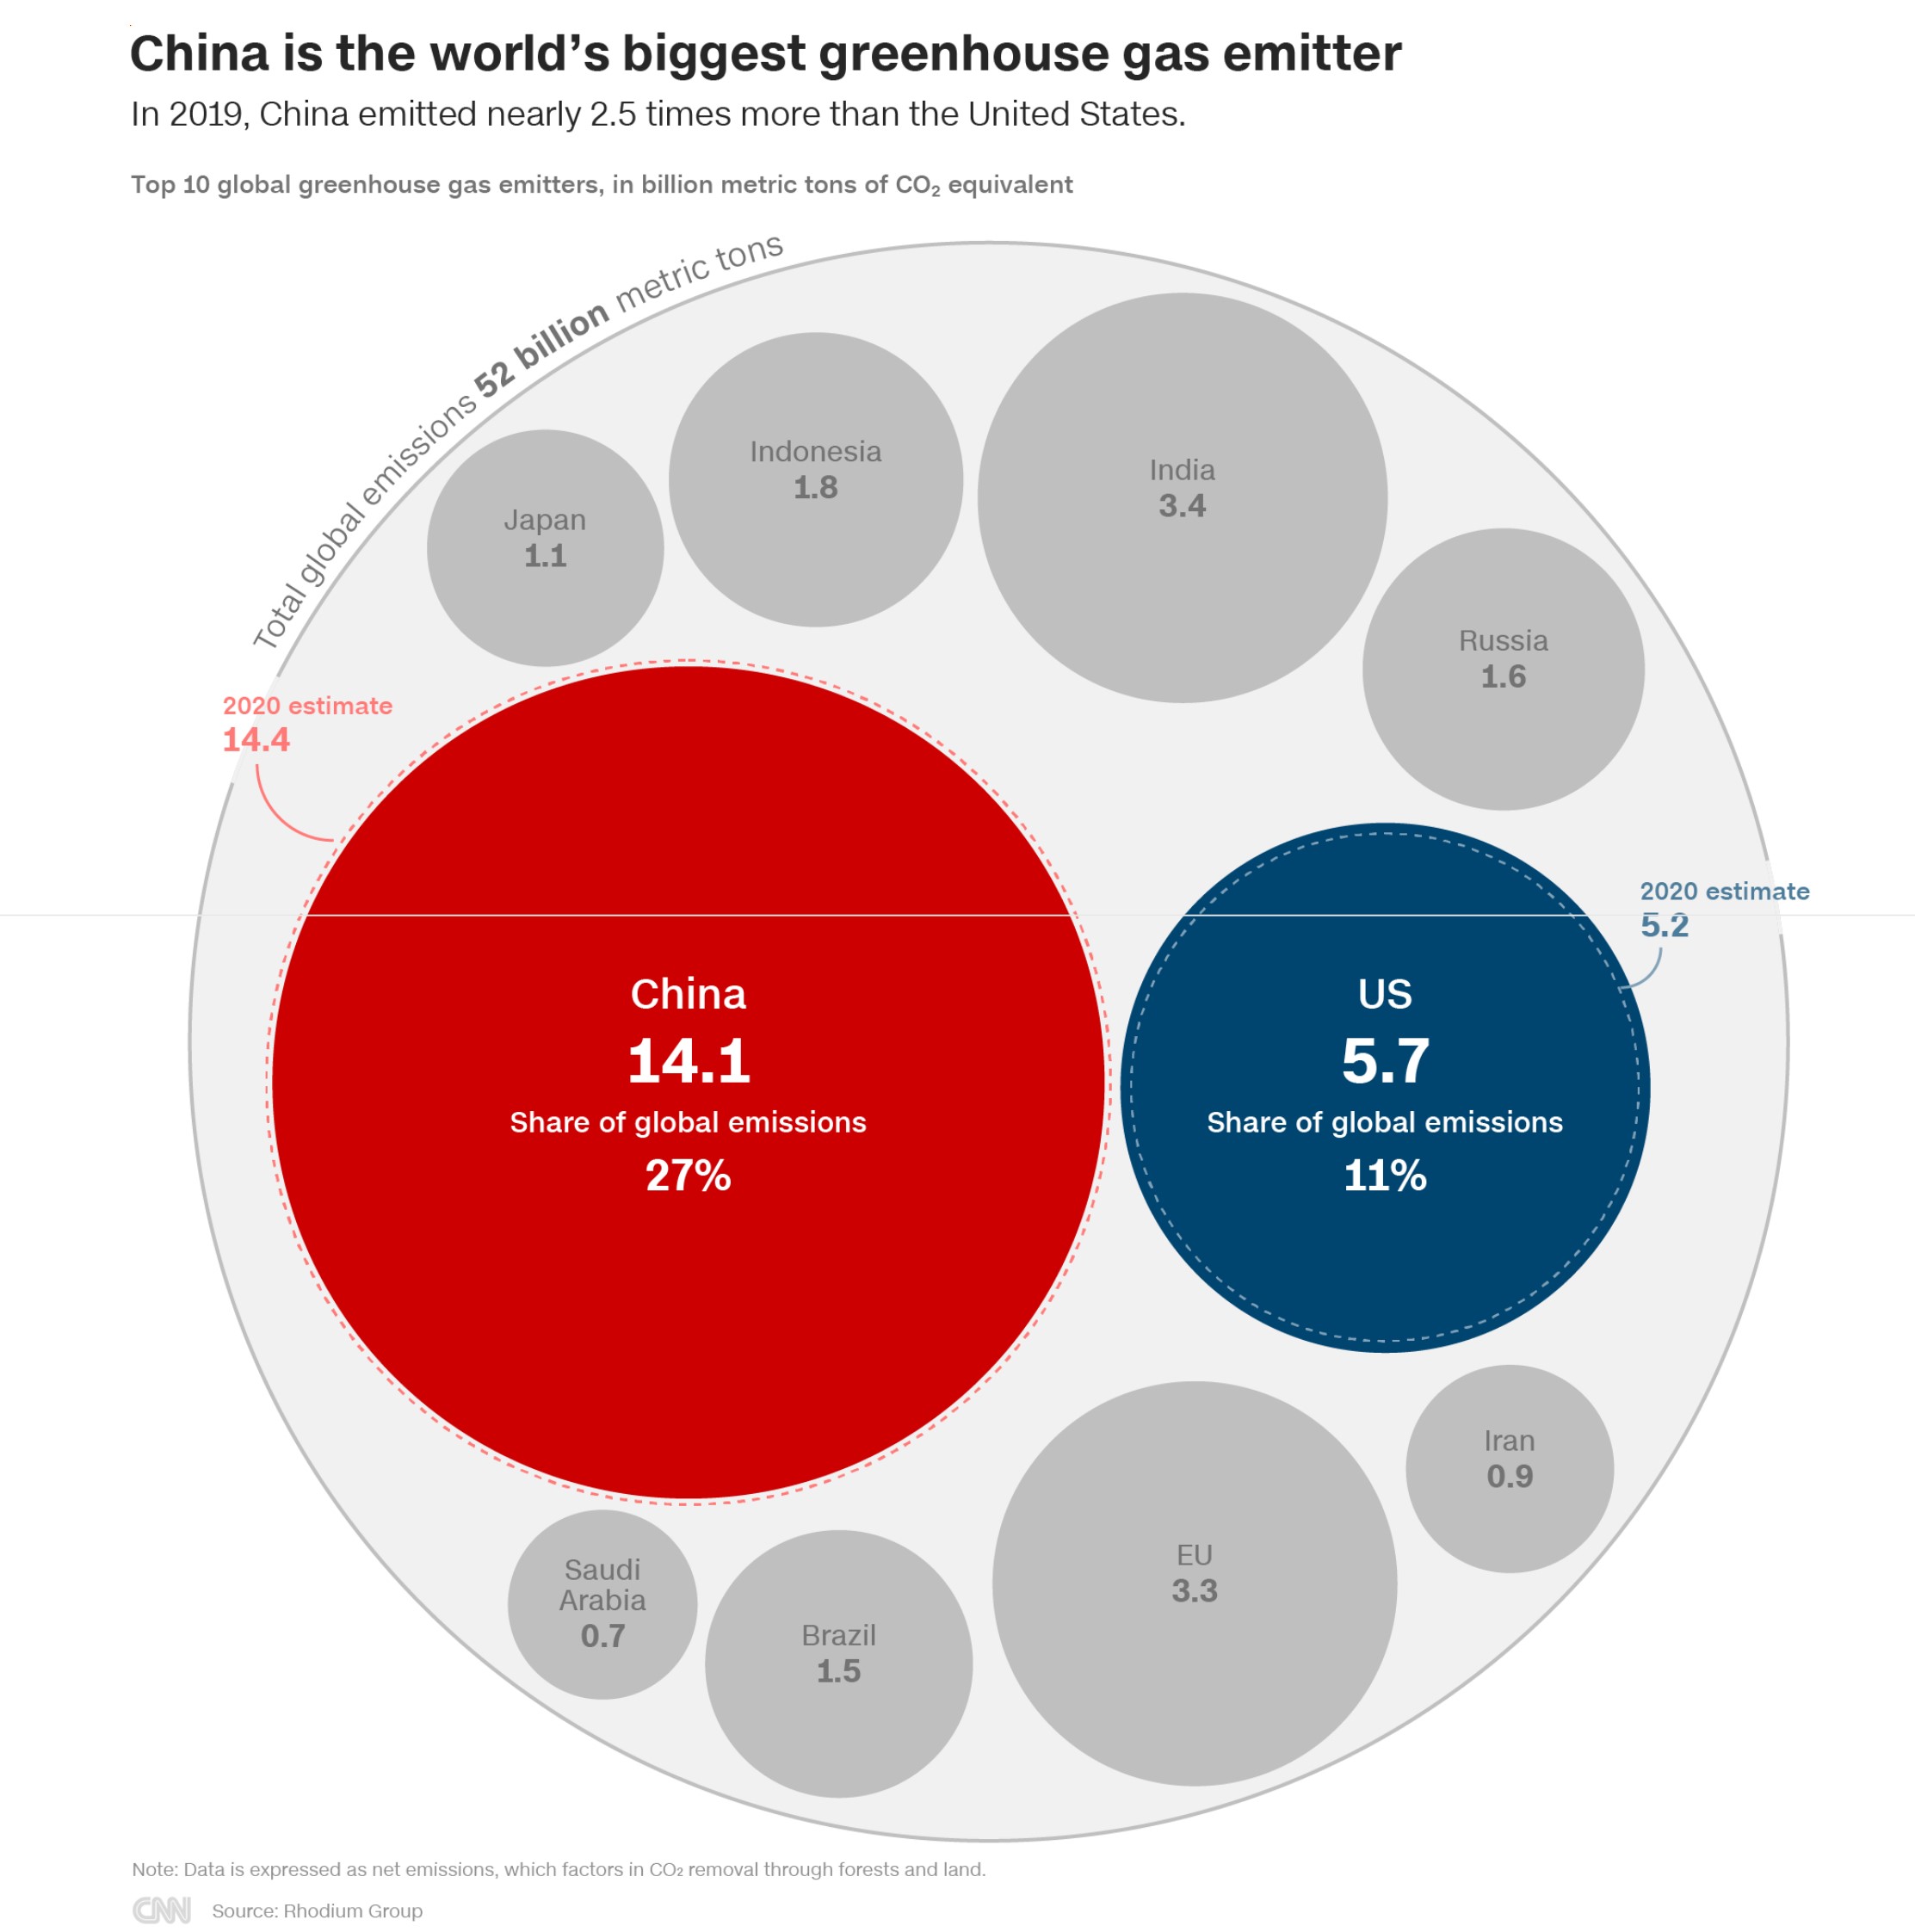
In 2019, the last year before the pandemic hit, China’s greenhouse gas emissions were nearly 2.5 times that of the US’, and more than all the world’s developed countries combined, according to an analysis from the Rhodium Group.
In terms of CO2 equivalent (a way of measuring all greenhouse gases as if they were CO2), China emitted 14.1 billion metric tons in 2019. That is more than a quarter of the world’s total emissions.
By contrast, the US was responsible for 5.7 billion tons or 11% of total emissions, followed by India (6.6%), and the European Union (6.4%).
Past Emissions
When scientists measure greenhouse gas emissions, they look at the total emissions a country pumps into the air on their own land every year. Those emissions come from anything powered by fossil-fuels, including driving cars powered by gasoline, flying, heating and lighting buildings with power generated from coal, natural gas or oil, as well as from powering industry. Other sources take into account emissions from deforestation.
No country in the world has put more greenhouse gases into the atmosphere than the United States. The US has surpassed other countries historically so by a long margin.
While China is by far the biggest emitter today, it has not always been so. The point is important because emissions released even hundreds of years ago have contributed to global warming today. The world has already warmed by 1.2 degrees Celsius since the start of the Industrial Revolution. Scientists believe we need to keep it to 1.5 degrees to stave off the worsening impacts of a climate crisis.
China’s CO2 emissions began accelerating in the 2000s as the country rapidly developed. Advanced countries, such as the US, UK and many in Europe, had already been industrializing and emitting climate-altering gases in the process for ~200 years. A lot of comforts experienced in developed countries have come at the expense of the climate.
Since 1850, China has emitted 284 billion tons of CO2, according to new analysis by Carbon Brief (UK-based organization covering climate, energy and policy).
The US, on the other hand, industrialized decades earlier and has released 509 billion tons of CO2 or twice as much.
Emissions per Person
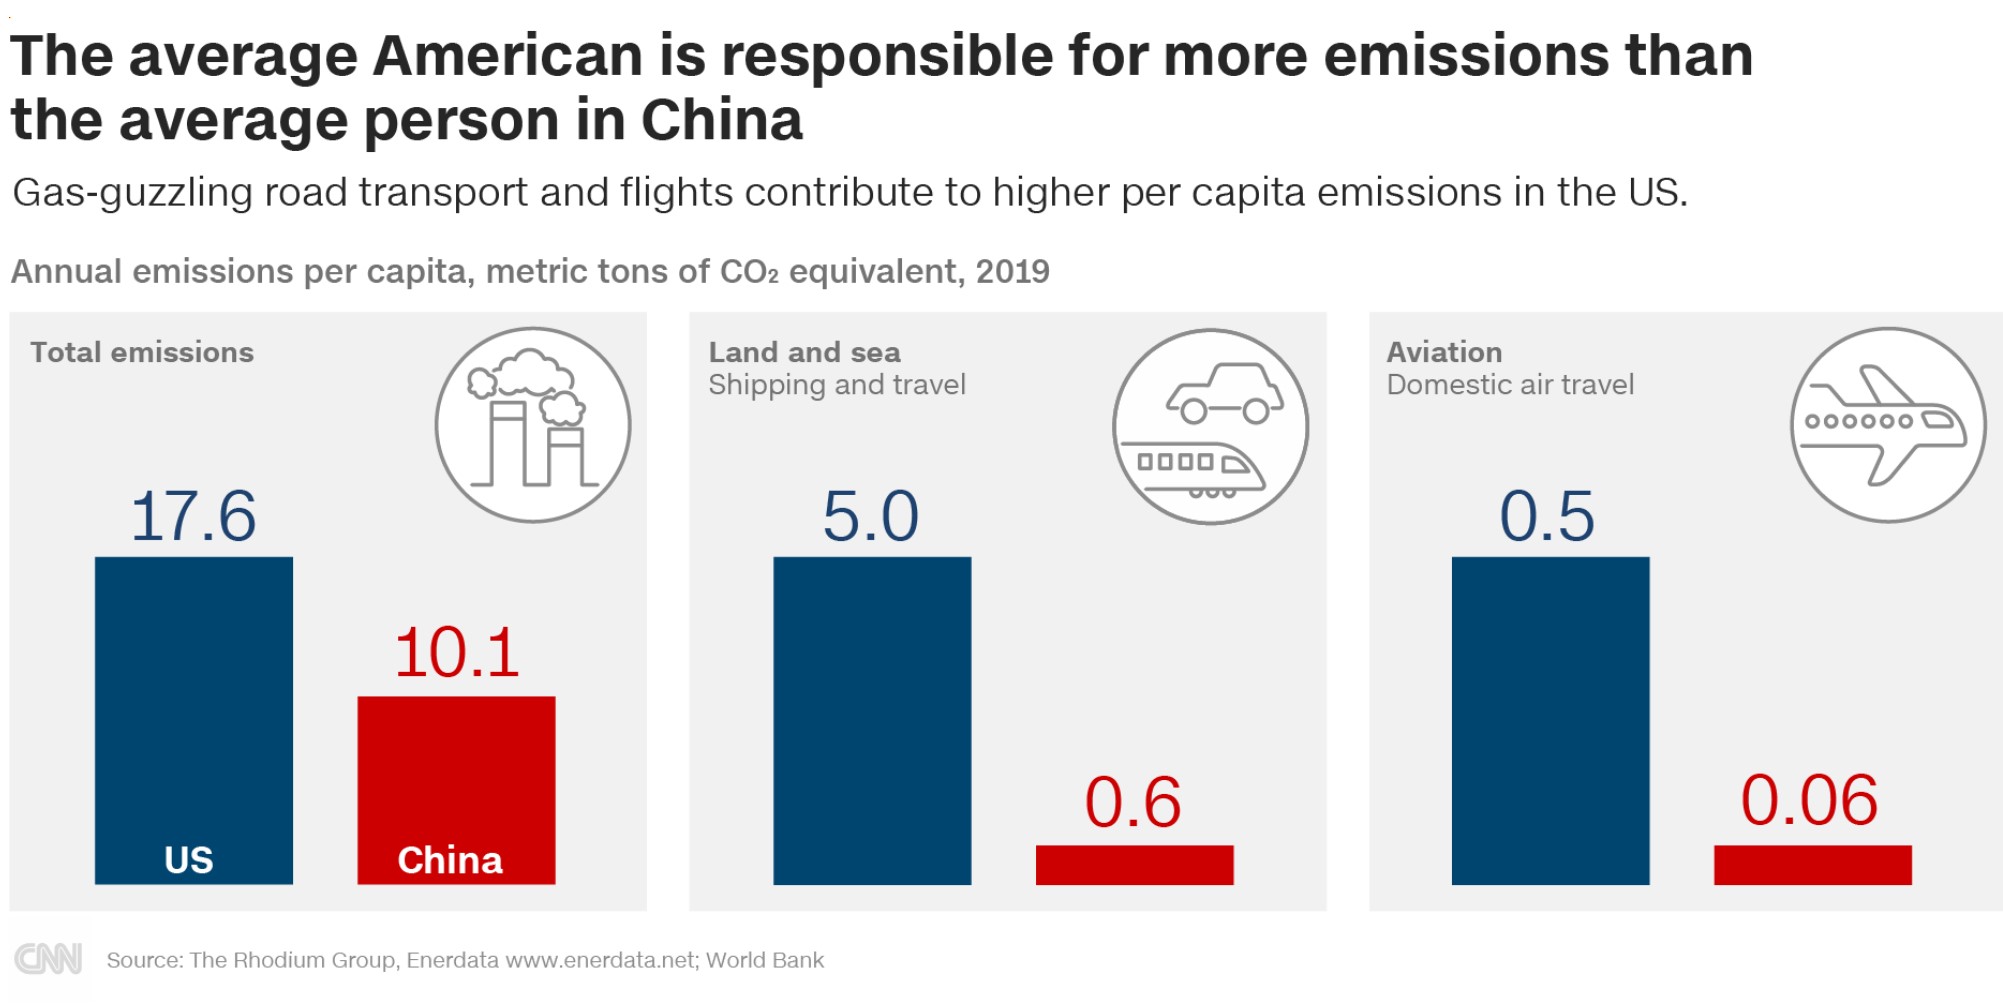
China is a huge country of 1.4 billion people. It makes sense, China would emit more than smaller nations overall. But when you look at emissions per capita, the average Chinese person emits quite a bit less than the average American.
In 2019, China’s per capita emissions reached 10.1 tons. By comparison, the US reached 17.6 tons, according to the Rhodium Group.
This in part comes down to lifestyle. Americans earn more money, they own more gas-guzzling cars, and they fly more than the average Chinese person. This according to Climate Transparency’s 2021 report, citing independent energy research company Enerdata.
That is not to say China should not be slashing emissions. China’s per capita carbon footprint is rapidly catching up with those of wealthier nations. In the past 20 years, the per capita carbon footprint has nearly tripled.
Fossil Fuel
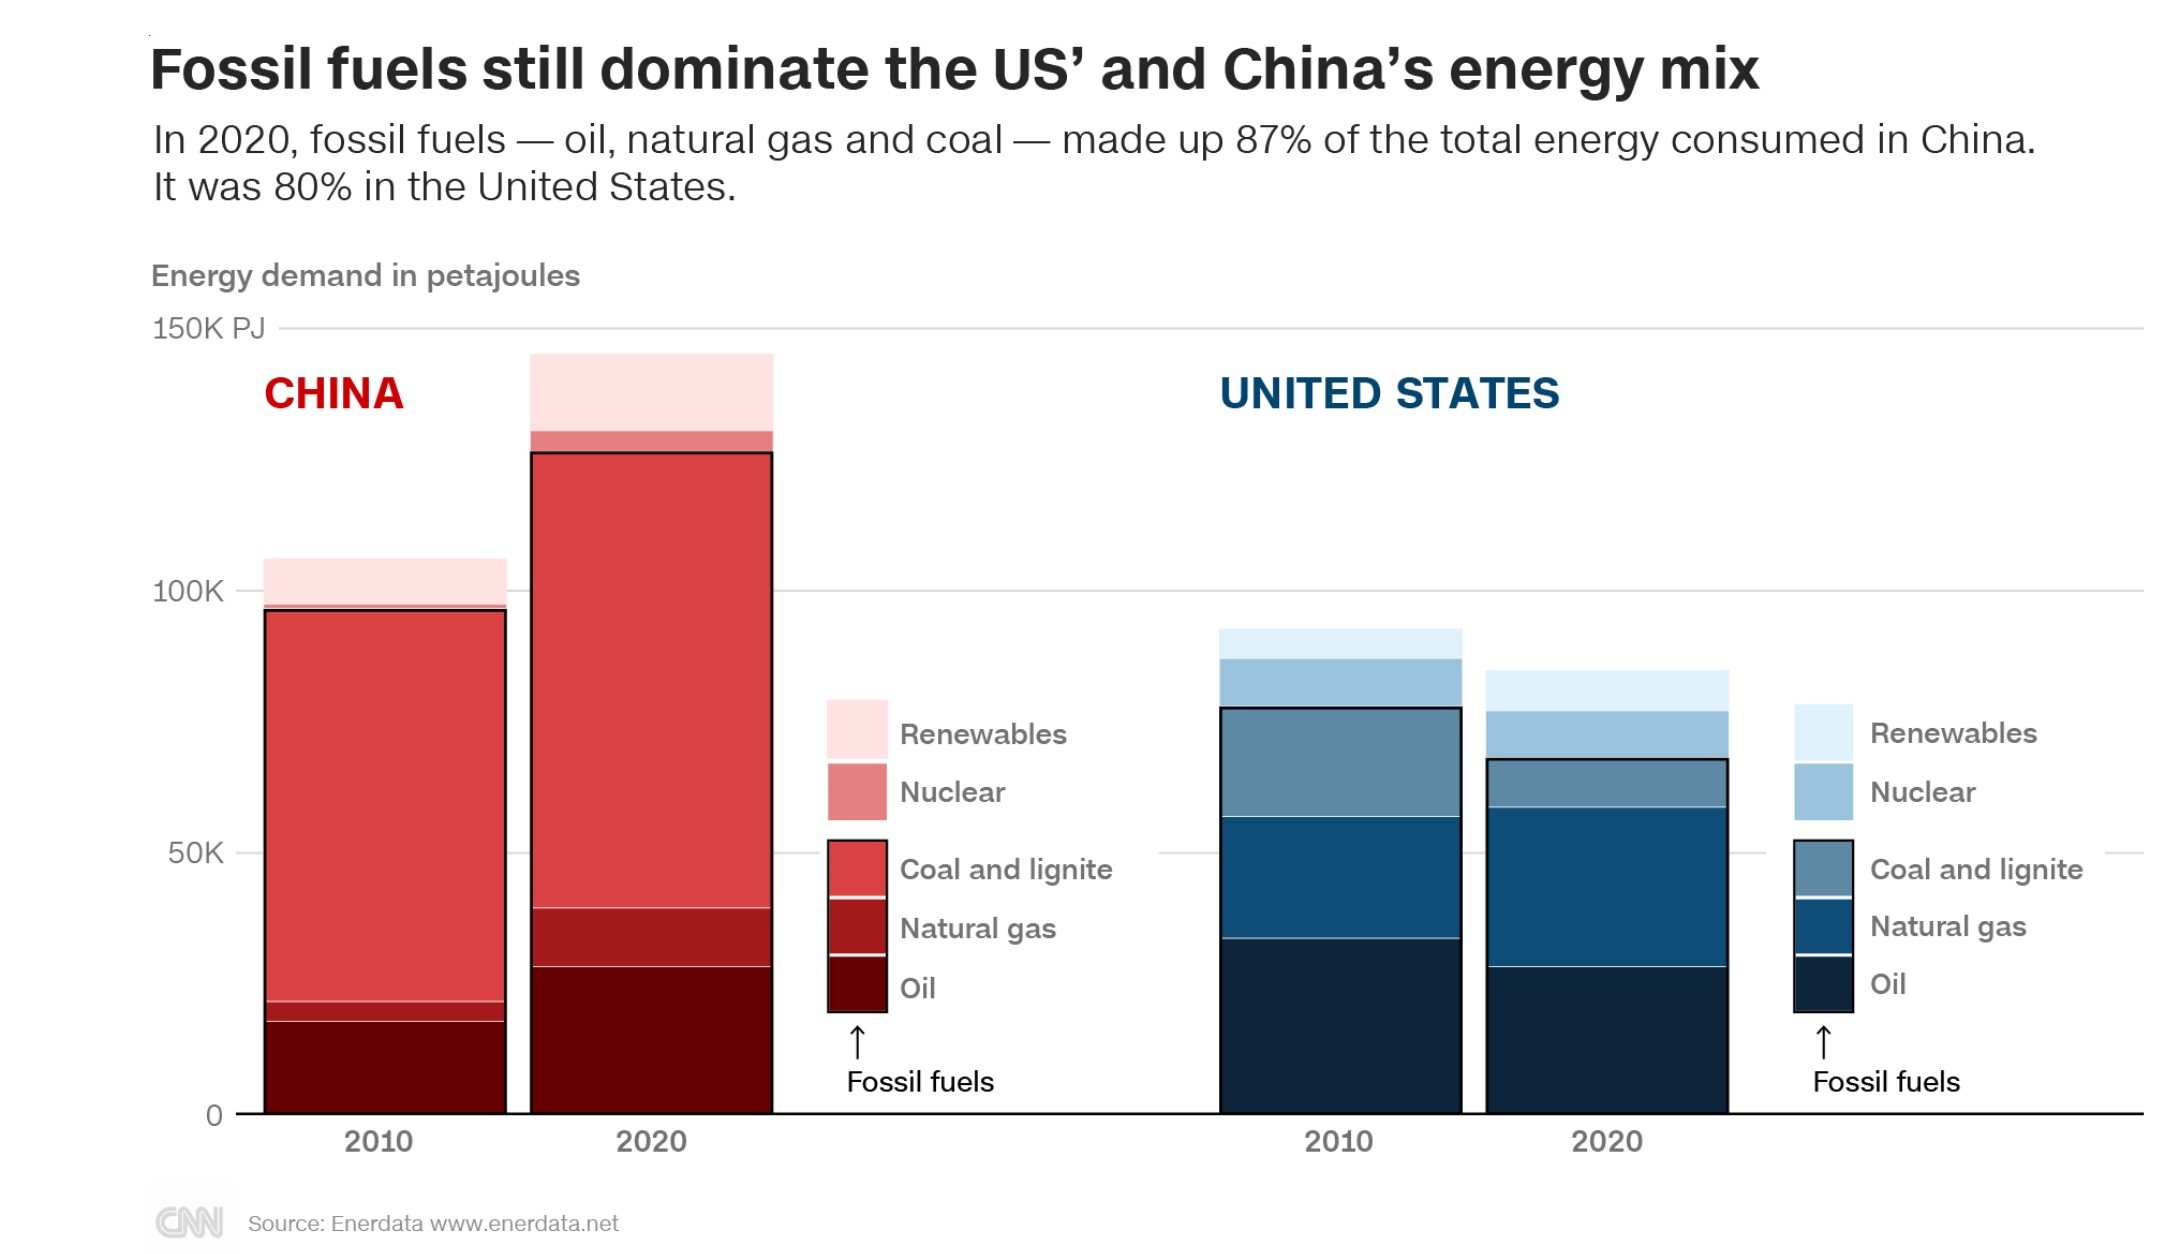
In 2020, fossil fuels made up 87% of China’s domestic energy mix, with 60% from coal, 20% from oil, and 8% from natural gas, according to Enerdata.
In the US, 80% of the energy mix comes from fossil fuels. Of that, 33% is from oil, 36% from natural gas, and 11% from coal (Enerdata).
Natural gas produces fewer emissions than coal, but it is still harmful to the climate. There are growing concerns the US and other parts of the world are investing too heavily in gas instead of renewables.
China is the world’s biggest user and producer of coal, consuming more than half the world’s supply. In part, this is due to China producing so many products and materials for the world, which is why it’s sometimes referred to as “the world’s factory.”
China produces more than half of the world’s steel and cement, which is made from burning coking coal. Alternative fuels for these heavy industries, like green hydrogen, are in development but are not widely available yet at scale. The emissions from just those two industries in China are higher than the European Union’s total CO2 emissions, according to the International Energy Agency (IEA).
To reach net zero by 2050, 90% of global electricity generation should come from renewable sources. with solar and wind accounting for nearly 70%, according to the IEA.
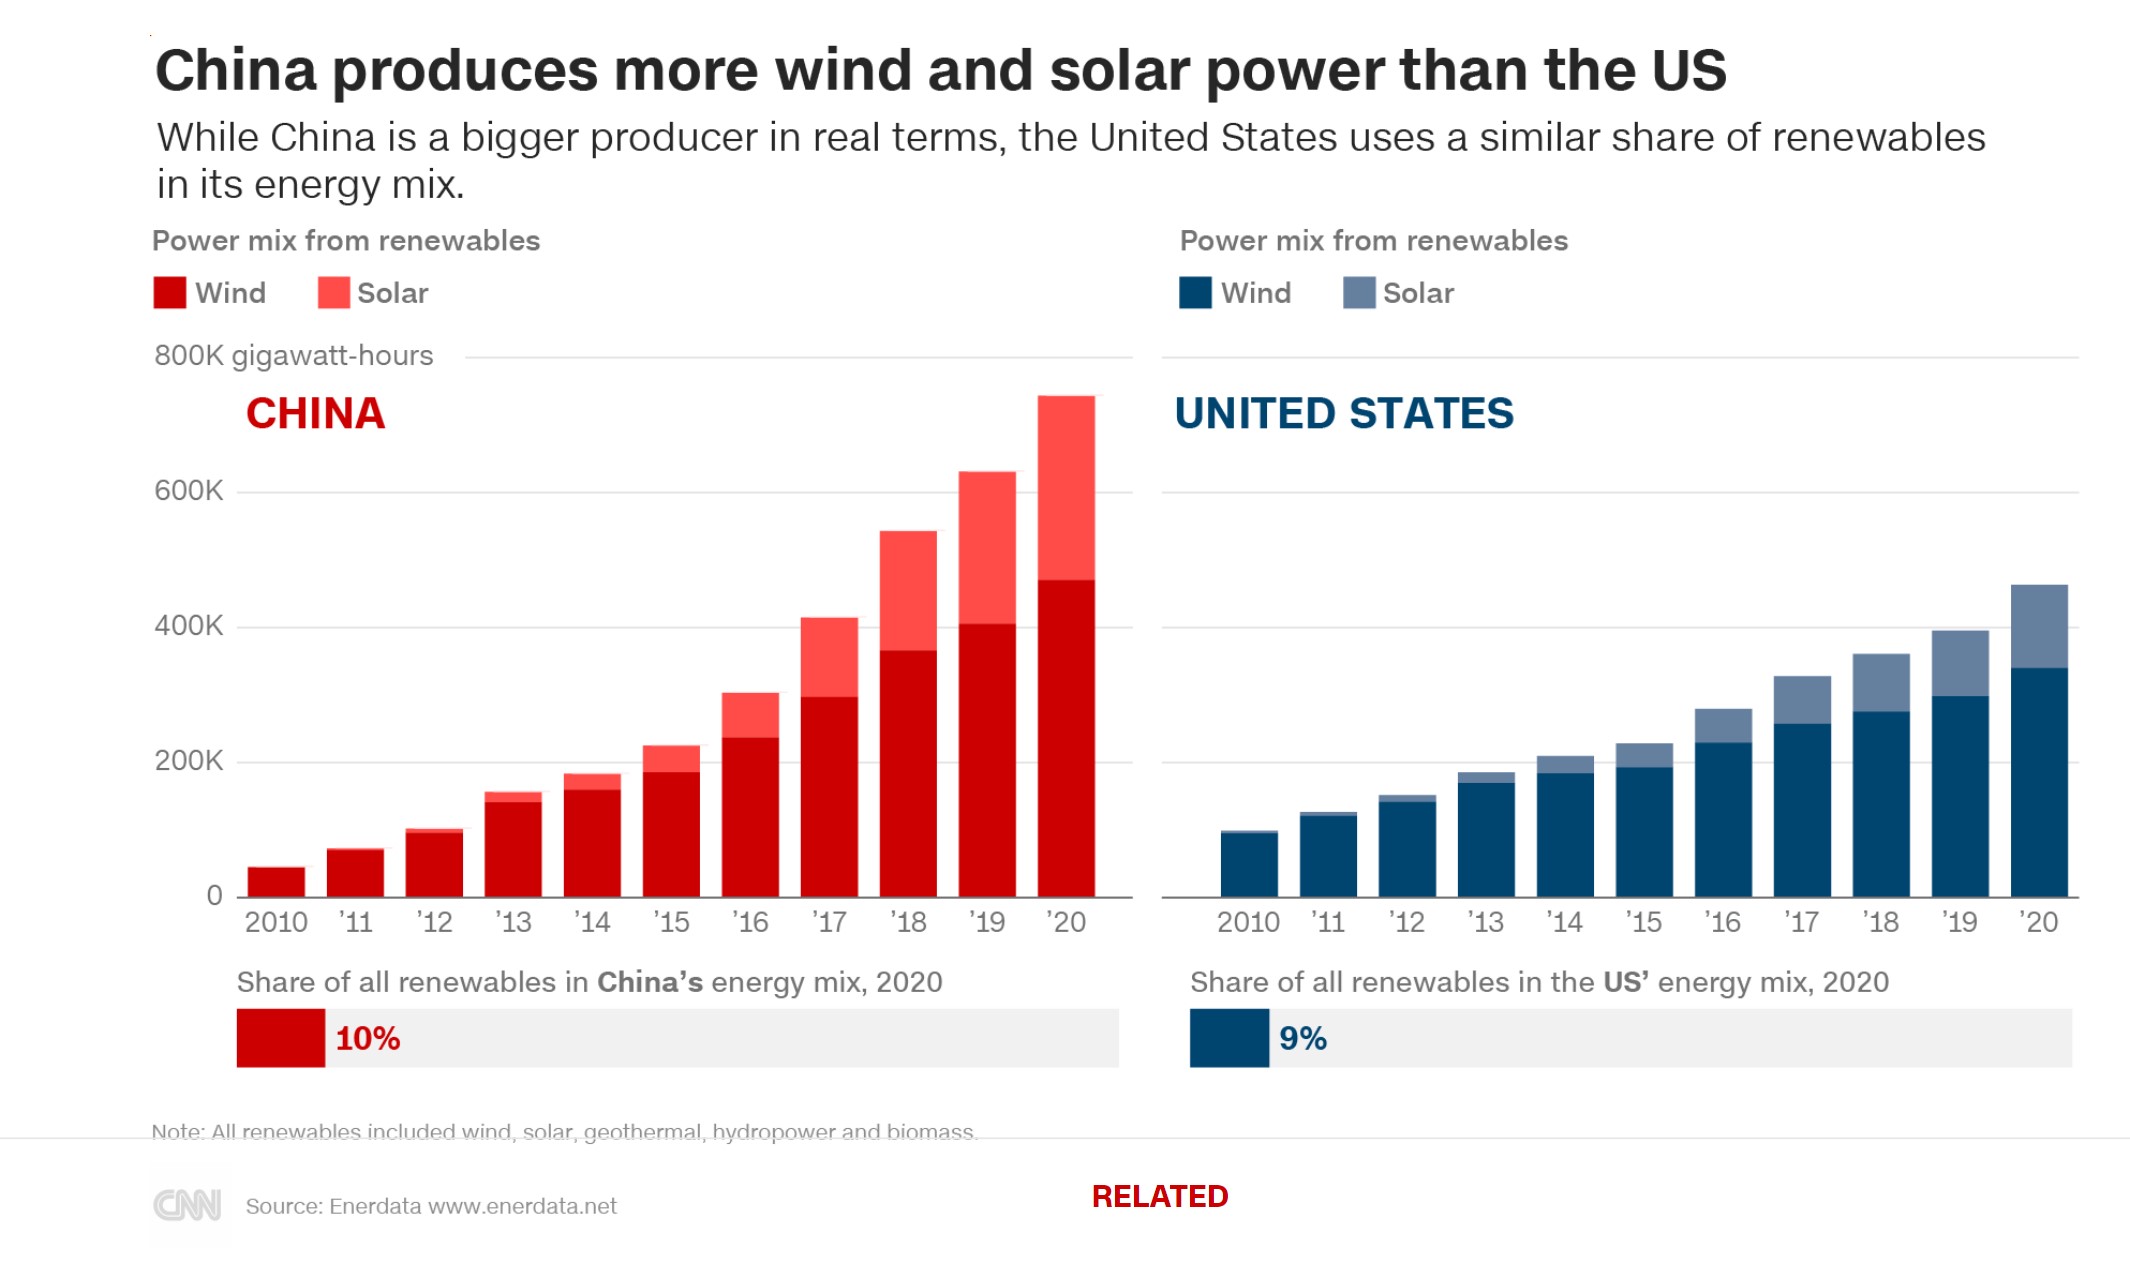
Wind and Solar
While China is the world’s biggest emitter, still relies heavily on coal; it is producing huge amounts of renewable energy as well.
In terms of energy mix, China and the US are around the same. Wind, solar, hydro-power, geothermal, as well as biomass and waste, make up 10% of China’s energy consumption.
The US was not far off, at 9%. But nearly half is from biomass, which is energy derives from substance that were recently alive, like wood from trees, algae or animal waste. Some experts and scientists argue, it is not truly renewable.
But because China uses much more power overall, it has produced more renewable energy than the US in real terms. In 2020, China produced 745,000 gigawatt-hours of energy from wind and solar, according to Enerdata. The US produced 485,000 gigawatt-hours.
In terms of capacity, however, China was the global leader in 2020, when it built nearly half of all the world’s renewables installations, according to the Renewables 2021 Global Status Report. It nearly doubled its capacity from 2019.
China has also built vast solar and wind farms. It is also producing more solar PVs and wind turbines than any other nation. It has the biggest electric vehicle market, taking 38.9% of the global share of electric car sales, while the US took 9.9%, a renewables report said.
So, what’s the verdict?
Looking ahead, the US’ climate plans are more ambitious than China’s. US President Joe Biden has pledged to at least halve US emissions by 2030, from 2005 levels. China is at a different stage of development. It should be a factor in working out what the country’s fair share of climate action should be. China is also ahead of the US on renewables.
It’s also yet to be seen how much of the US Democrats’ cornerstone climate policy can make it through Congress.
China expresses its commitments in terms of “carbon intensity” which allows for more emissions the more its GDP rises, which makes it difficult to compare to the US’. It submitted its new emissions plan to the UN on Thursday, but made only a modest improvement.
Climate Action Tracker, which synthesizes countries’ targets, rates the US’ domestic policies as better than China’s, almost on track to contain global warming to 2 degrees Celsius. When adjusted to consider what would be each country’s fair share, they both get a ‘highly insufficient” rating.
In other words, neither country is cutting enough carbon or making the transition to renewables fast enough to limit warming to 1.5 degrees.
CNN’s Yong Xiong contributed reporting. CNN Graphics by Natalie Croker, Marco Chacon and Henrik Pettersson.
Fortune is blaming July heat on an undersea volcano, while Big Oil hires ‘influencers’ to deflect responsibility
In other words: business as usual
Ten Bears:
Of Course, nothing changes. It is your fault!
I might not be very tall, but I’ve got broad shoulders
All this talk about ‘fair share’ is a waste of time, looking for ways to avoid accepting responsibility for our collective actions. We’re not gonna’ fix the problem bickering over who has emitted more. We have emitted more. The so-called United States is responsible for the lion’s share of emissions and like the refusal to admit that we humans are responsible for what we’ve done talk about fair share is just looking to blame someone else
The reality is we are all in this together
Ten Bears:
Yes, the Schooner Tuna Motto from “Mr. Mom.” “we are all in this together.” And some more than others. It would be nice if we just did it and talk about the road to it later.
@Bill,
Great post!
yes, we need to be reminded
but the idea of “fair share” unnnerves me. my neighbors house is on fire, the fire threatens to spread to my house. we need to sit down and talk about what is our fair share of fighting this fire?
i had to end the above with a question mark because i have seen that most people think that arguing about “fair share” is the “fair” thing to. after all, it is important to know who got the biggest piece of the burfday cake and correct the injustice of it all.
Rewriting the careless note I left:
A dismissive, sarcastic analogy about sharing in climate change obligations makes no sense to me. Of course fair sharing must be discussed and negotiated in the setting of climate change obligations. As for China, the obligations agreed to are being and will be completed 5 and more years early.
ltr:
I put this up at Angry Bear purposely. I thought it was a fair assessment of where China and the US are on climate change. Much of the climate issues can be negated by addition changes by both countries. This was not meant to antagonize you.
my neighbors house is on fire, the fire threatens to spread to my house. we need to sit down and talk about what is our fair share of fighting this fire?
[ This dismissive sarcastic analogy makes no sense to be. Of course “fair share” must be discussed and negotiated in terms of climate change obligations. ]
ltr
not sarcastic. we have an existential emergency. we need everyone to do everything they can, soonest, not including heroic measures to fight global warming by poisoning the only planet we have.
the obvious first step is togive up our love affair with cars and air conditioning. which i suppose is kind of a sarcasic metaphor for giving up our lazy, stupid, selfish, “lifestyles.”
which only support our neurotic unhappiness.
I think it may be on the verge of getting real now. Iris dawning on more and more people that this change coming up is going to be very painful. A lot of prior information seemed to be that it was only going to take a minimal percentage of world GDP and even then that GDP would grow past it and we would be more prosperous only slower and in a sense way better without these terrible environmental issues from warming. In the past year though I have read stuff from quite serious people that this is essentially hogwash. The material (including water) and energy demands needed to scale solar and wind are very high and involve processes historically with very bad environmental impacts. Battery storage capacity and disposal have very similar issues. Hydro can’t scale much more and has major environmental impacts too. Even pumped hydraulic energy storage has significant environmental issues. Maybe it is bite the bullet on nuclear with its own challenges or do what you can with the other stuff and do a 50% energy reduction to make it work. Or real planetary interference with solar energy incidence. Or just burn up the carbon and see if another 50 years yields more promising options. I am seeing folks I don’t think of as whack jobs saying the 8 billion of us need to go to 2 billion or even lower. Sure they give it 100 years, but that’s only 2 lifespans even at 50 years! Heck even the rhetoric of just a year ago for BBB seems delusional. “You’ll have great jobs (union for sure).” What do Americans think great jobs are exactly? Ones where you live like you do today, but go boating or fly to the Caribbean more often!