Drug Overdose Death Rates in the US
This post is more of a copy and paste. If you read the sections and then the original piece, you will see I have changed some of the wording to accommodate the post itself. For example, the charts appear to the right of the wording rather than above.
For the longest time, I could not find graphs breaking out the numbers of deaths due to opioids until I happened upon the Senate’s Joint Economic Committee (JEC) report. This report by the NIDA breaks down the use of drugs further. They show the various causes of deaths or deaths by drug usage.
In particular and to keep in mind, it was the deliberate abuse of a1980 letter written by Jick and Porter to the NEJM. Abuse by Purdue Pharma to promote the use of OxyContin, etc. which led to the increase in usage and subsequent deaths. Such corresponds with the abuse of opioid medications.
What you may recognize in the following ten charts is beyond just Opioid abuse. It can be a combination of Opioid (synthetic, etc.) and other drugs If there are questions, ask in the comments section.
Drug Overdose Death Rates, National Institute on Drug Abuse, (NIDA) (nih.gov)
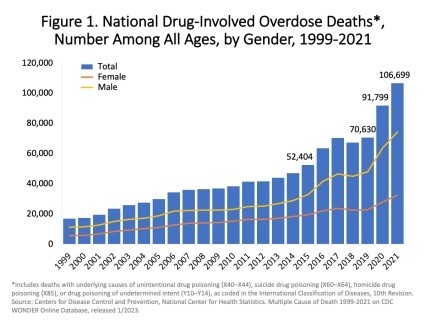
Figure 1. National Drug-Involved Overdose Deaths—Number Among All Ages, by Gender, 1999-2021. More than 106,000 persons in the U.S. died from drug-involved overdose in 2021, including illicit drugs and prescription opioids. The bar and line graph to the right details the total number of U.S. drug overdose deaths involving select illicit or prescription drugs each year from 1999 to 2021. The bars are overlaid by lines detailing the number of deaths by gender from 1999 to 2021 (Source: CDC WONDER).
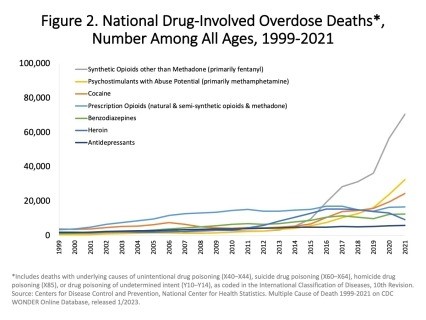
Figure 2. National Drug-Involved Overdose Deaths by Specific Category—Number Among All Ages, 1999-2021. Overall, drug overdose deaths rose from 2019 to 2021. More than 106,000 drug overdose deaths being reported in 2021. Deaths involving synthetic opioids other than methadone (primarily fentanyl) continued to rise with 70,601 overdose deaths reported in 2021. Those involving stimulants including cocaine or psychostimulants with abuse potential (primarily methamphetamine), also continued to increase with 32,537 overdose deaths in 2021 (Source: CDC WONDER).
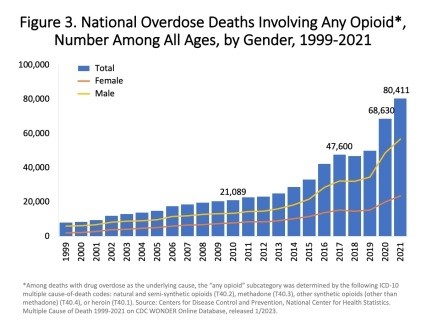
Figure 3. National Overdose Deaths Involving Any Opioid—Number Among All Ages, by Gender, 1999-2021. The bar and line graph to the right shows the total number of U.S. overdose deaths involving any opioid from 1999 to 2021. The term any opioid includes prescription opioids (natural and semi-synthetic opioids and methadone), heroin, and synthetic opioids other than methadone [primarily fentanyl]). Opioid-involved overdose deaths rose from 21,089 in 2010 to 47,600 in 2017 and remained steady through 2019. This was followed by a significant increase in 2020 with 68,630 reported deaths and again in 2021 with 80,411 reported overdose deaths. The bars are overlaid by lines detailing the number of deaths by gender from 1999 to 2021 (Source: CDC WONDER).
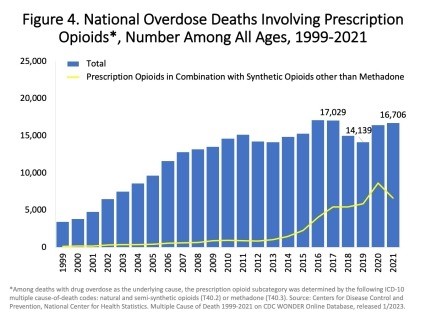
Figure 4. National Overdose Deaths Involving Prescription Opioids, by other Opioid Involvement—Number Among All Ages, 1999-2021. The bar and line graph to the right shows the total number of U.S. overdose deaths involving prescription opioids (including natural and semi-synthetic opioids and methadone) from 1999 to 2021. Drug overdose deaths involving prescription opioids rose from 3,442 in 1999 to 17,029 in 2017. From 2017 to 2019, the number of deaths declined to 14,139. This was followed by a slight increase in 2020, with 16,416 reported deaths. In 2021, the number of reported deaths involving prescription opioids totaled 16,706. The bars are overlaid by a line showing the number of deaths involving prescription opioids in combination with synthetic opioids other than methadone (primarily fentanyl) from 1999 to 2021 (Source: CDC WONDER).
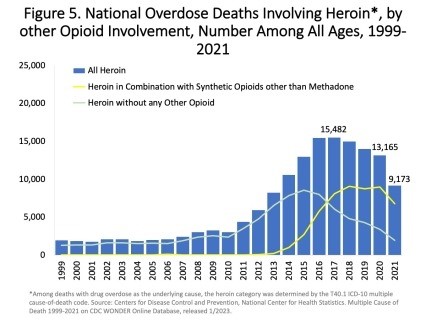
Figure 5. National Overdose Deaths Involving Heroin, by Other Opioid Involvement—Number Among All Ages, 1999-2021. The bar and line graph to the right shows the total number of U.S. overdose deaths involving heroin from 1999 to 2021. Drug overdose deaths involving heroin rose from 1,960 in 1999 to 15,482 in 2017 before trending down to 13,165 deaths in 2020 and 9,173 deaths in 2021. The bars are overlaid by lines showing the number of deaths involving heroin in combination with synthetic opioids other than methadone (primarily fentanyl) or without any other opioid from 1999 to 2021 (Source: CDC WONDER).
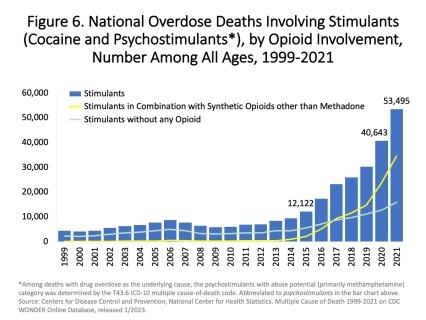
Figure 6. National Overdose Deaths Involving Stimulants (cocaine and psychostimulants), by Opioid Involvement—Number Among All Ages, 1999-2021. The bar and line graph to the right shows the total number of U.S. overdose deaths involving stimulants from 1999 to 2021. Drug overdose deaths rose from 12,122 in 2015 to 53,495 in 2021. The bars are overlaid by lines detailing the number of deaths involving stimulants in combination with synthetic opioids other than methadone (primarily fentanyl) or without any opioid. The number of deaths involving stimulants has increased steadily since 2014 regardless of opioid involvement (Source: CDC WONDER).
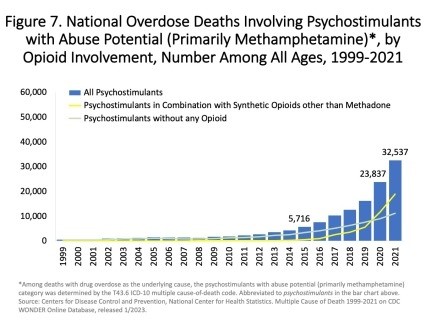
Figure 7. National Overdose Deaths Involving Psychostimulants with Abuse Potential (Primarily Methamphetamine), by Opioid Involvement. Number Among All Ages, 1999-2021. The bar and line graph to the right shows the total number of U.S. overdose deaths involving psychostimulants with abuse potential from 1999 to 2021. Drug overdose deaths involving psychostimulants with abuse potential rose from 547 in 1999 to 23,837 in 2020 continuing to increase to 32,537 deaths in 2021. The bars are overlaid by lines showing the number of deaths involving psychostimulants in combination with synthetic opioids other than methadone (primarily fentanyl) or without any opioid. The number of deaths involving psychostimulants has increased steadily since 2014 regardless of opioid involvement (Source: CDC WONDER).
Figure 9. National Drug Overdose Deaths Involving Benzodiazepines, by Opioid Involvement—Number Among All Ages, 1999-2021. The bar and line graph to the right shows the total number of U.S. overdose deaths involving benzodiazepines from 1999 to 2021. Drug overdose deaths involving benzodiazepines steadily increased from 1,135 in 1999 to 11,537 in 2017 and declined to 9,711 in 2019. Between 2019 and 2021, deaths rose again to 12,499. The bars are overlaid by lines showing the number of deaths involving benzodiazepines in combination with synthetic opioids other than methadone (primarily fentanyl) or without any opioid (Source: CDC WONDER).

Figure 10. National Drug Overdose Deaths Involving Antidepressants, by Opioid Involvement–Number Among All Ages, 1999-2021. The bar and line graph to the right shows the total number of U.S. overdose deaths involving antidepressants from 1999 to 2021. Drug overdose deaths involving antidepressants rose steadily from 1,749 in 1999 to 5,269 in 2017. Since then, deaths have slightly risen with 5,859 in 2021. The bars are overlaid by lines showing the number of deaths involving antidepressants in combination with synthetic opioids other than methadone (primarily fentanyl) or without any opioid involvement (Source: CDC WONDER).
Other Resources
Senators, Opioids, and EpiPens, Angry Bear, angry bear blog
W.Va. Court Rules in Favor of Drug Wholesalers, Angry bear, angry bear blog
Is ‘Big Pharma’ To Blame For the Opioid Crisis? Angry Bear, angry bear blog