Jobless claims: steady as she goes
Jobless claims: steady as she goes
by New Deal democrat
[ Special programming note: yesterday’s Fed action, and more important the statements made afterward, merit special attention. I will put up a special post on that later today.]
Initial jobless claims remained at their recent low level, down -1,000 from one week ago to 217,000. The 4 week average declined -500 to 218,750. Continuing claims, which lag slightly, rose 47,500 to a 7 month high of 1,485,000:
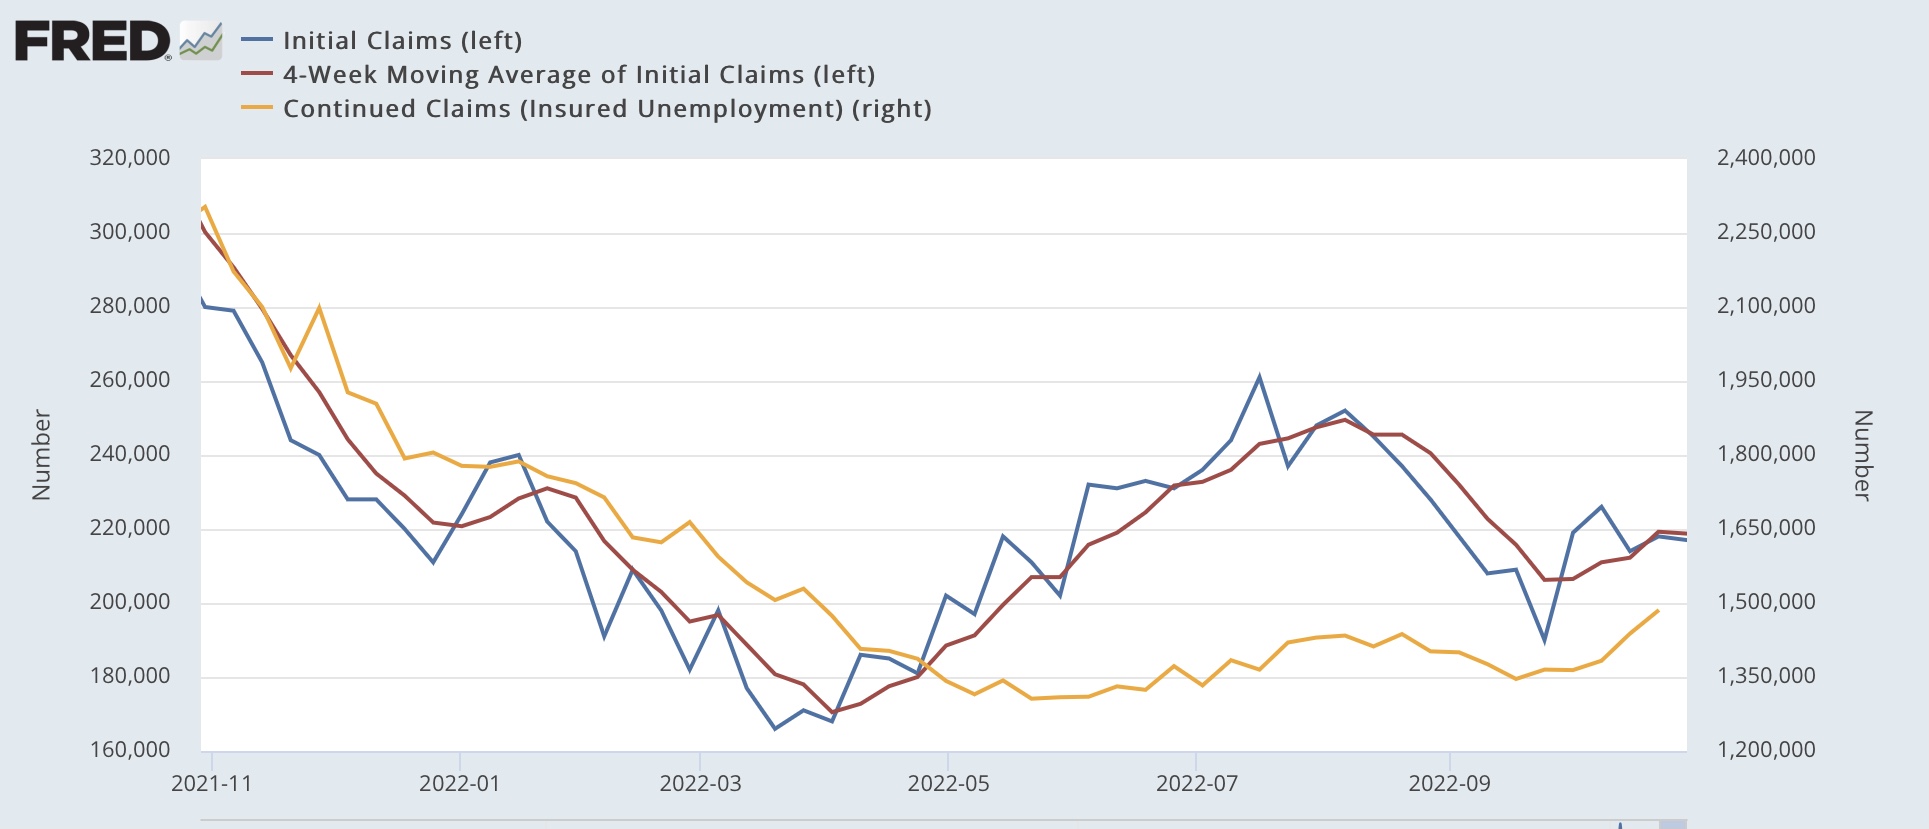
The recent upturn and downturn in jobless claims looks bigger in this graph than it has in the past two years, but it is all because the big numbers of 2020 and earlier n 2021 have disappeared from this 1 year timeframe. At any point in the past half century, jobless claims on the order of 300,000/week (as they were 1 year ago) would have been considered very good indeed.
So, this remains good news. Very few people are getting laid off.
There are a few implications for tomorrow’s jobs report, so let’s briefly update those.
First, jobless claims lead the unemployment rate by several months. Here are the 4 week average of jobless claims (red) vs the unemployment rate (blue) for the past two years:

I expect that the 3.5% unemployment rate recorded in July and September will likely be the low for this expansion, although so far there is no reason to expect any big increase.
Second, consumption leads employment. Here is a graph updated through last month’s data for real retail sales (blue, /2 for scale) and monthly % of job gains (red):

Average YoY job gains monthly have been slowly decreasing this year. Except for the big positive outlier in July (+537,000 jobs), since March they have trended down from +398,000 jobs to +263,000 in September. While any given month’s number can be volatile, the trend in consumption strongly suggests that this decreasing trend in job gains will continue tomorrow’s report for October.
Jobless claims: steady as she goes
– by New Deal democrat
[ Special programming note: yesterday’s Fed action, and more important the statements made afterward, merit special attention. I will put up a special post on that later today.]
Initial jobless claims remained at their recent low level, down -1,000 from one week ago to 217,000. The 4 week average declined -500 to 218,750. Continuing claims, which lag slightly, rose 47,500 to a 7 month high of 1,485,000:
The recent upturn and downturn in jobless claims looks bigger in this graph than it has in the past two years, but it is all because the big numbers of 2020 and earlier n 2021 have disappeared from this 1 year timeframe. At any point in the past half century, jobless claims on the order of 300,000/week (as they were 1 year ago) would have been considered very good indeed.
So, this remains good news. Very few people are getting laid off.
There are a few implications for tomorrow’s jobs report, so let’s briefly update those.
First, jobless claims lead the unemployment rate by several months. Here are the 4 week average of jobless claims (red) vs the unemployment rate (blue) for the past two years:
I expect that the 3.5% unemployment rate recorded in July and September will likely be the low for this expansion, although so far there is no reason to expect any big increase.
Second, consumption leads employment. Here is a graph updated through last month’s data for real retail sales (blue, /2 for scale) and monthly % of job gains (red):
Average YoY job gains monthly have been slowly decreasing this year. Except for the big positive outlier in July (+537,000 jobs), since March they have trended down from +398,000 jobs to +263,000 in September. While any given month’s number can be volatile, the trend in consumption strongly suggests that this decreasing trend in job gains will continue tomorrow’s report for October.
“Jobless claims flat for the moment,” Angry Bear, New Deal democrat.
https://www.nytimes.com/live/2022/11/04/business/jobs-report-october-economy/the-job-market-probably-cooled-but-stayed-strong-last-month?smid=url-share
NY Times – just in
Job growth remained stubbornly robust in October despite higher interest rates, defying policymakers’ efforts to dampen the labor market and curb the fastest inflation in generations.
Employers added 261,000 jobs last month on a seasonally adjusted basis, the Labor Department said Friday. That was down from 315,000 in September. The unemployment rate rose to 3.7 percent. …
The report offered a final glimpse of the economy before the midterm elections next week, and it will almost certainly make its way into both parties’ closing pitches to voters. …
BLS News Release
Yes, it’s a jobs report that not only beat estimates, but provided underlying reasons that inflation is still a huge issue the FED will attempt to tackle well into 2023. Not only did the October numbers beat estimates, but they revised the September number UP 52,000 to 315,000.
And labor participation declined to 62.2%. That means it’s 37.8% less than full participation, so it’s further losses in tax receipts and contributions to social security than optimum. This is why killing high inflation is so, so important.
Grayson:
Here, you are not telling the full story on Participation Rate. More later, I am going the walk my German Shepard and get out in the sun.