Housing permits jump; the last hurrah before mortgage rates bite?
Housing permits jump; the last hurrah before mortgage rates bite?
This morning’s report on January housing permits and starts highlighted the unique divergence between the two. As I have often pointed out, permits are the more leading and less noisy of the two reports, so I usually highlight them, especially single family permits.
But in the past year there has been a marked divergence in trend between the two data sets, as permits soared then sank, while starts have been much more steady. The explanation for the divergence is the huge number of housing units for which permits have been taken out, but on which construction has not started. In January that was 280,000 on a seasonally adjusted basis (red), the highest such number since non-seasonally adjusted records (blue) began in 1974:
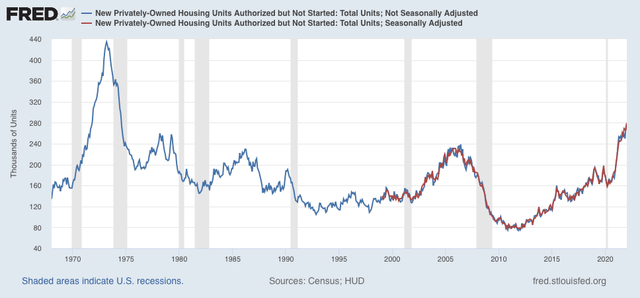
There are simply a huge number of units that *could* be started, but haven’t, probably because of a shortage of some necessary materials (I’ve heard, e.g., that windows are particularly in short supply).
With that in mind, below are total housing permits (blue), total starts (gray), and single family permits (red, right scale):
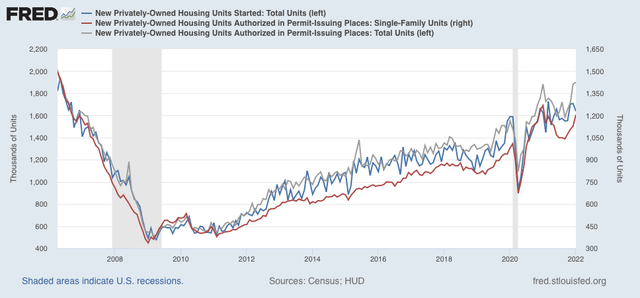
As you can see, there was a surge in permits one year ago, which then declined sharply. Total permits have risen again, to 1.899 million annualized, the highest number since September 2005. Single family permits also rose to 1.205 million, a one year high, but below January 2021’s high of 1.268 million.
Starts, on the other hand, declined to 1.638 million. I deal with that by averaging the last 3 months, which makes the number much less volatile. That average, 1.683 million, is the highest number since September 2006. A close-up of the three series since 2019 is below, better to show that actual starts have varied around 1.600 million in the past 12 months:
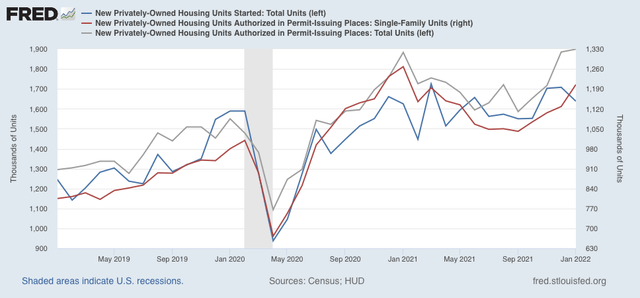
Since starts are the actual, hard economic activity, this indicates that housing is still a positive for the economy looking out ahead 12 months.
A big surge in housing permits in the face of rising mortgage rates, at least initially, is not really a surprise. The same thing happened several times in the past decade, notably in early 2014 and 2016, as potential buyers rush to close before rates climb even higher. Housing (blue and gray below, /10 for scale) does follow mortgage rates (red), but with a 3 to 6 month lag as shown in the graph of the YoY% change in each for the past 10 years, which I have run many times in the past:
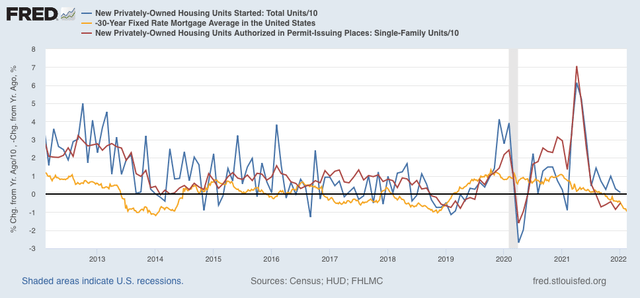
After this surge, which may persist another month or so, I fully expect housing starts and permits to decline, and substantially, in accord with the big increase in mortgage rates to over 4%, about 1.3% above their 2021 lows.
While “the big increase in mortgage rates to over 4%” seems hysterically ahistorical, then I still wonder if that means that the assessed values of residential real estate will soften along with the sale prices?
If the sales prices go down. Local comps still are the biggest factor. Meanwhile, that higher interest rate affects payments by around $58/month per hundred thousand dollars. Can’t be a whole lot of people discouraged by that.
Understood and thanks.
EM
True on the increases. Down where we are, we were priced out of Queen Creek, old homes needed updating, and went further west. Locked in at 2.6% assumable mgt. with less down. Our monthly funds allows for this mortgage and applied principal is large.
You are correct on the comps. Price of our home jumped $21000 since we signed a contract. One of the few times I have been happy with the mortgage and bank. AZ also allows you to walk away from a house and just hand over the keys. Don’t need to do such with a fixed rate assumable.
NDd:
I look at the trends you display since 2009 and I begin to wonder where the capacity went to build the materials required in housing manufacturing. Because demand decreases does not imply a decrease in capacity immediately. How much of a shortage is contrived?
I live in a wood producing area. The forests produce wood at a pretty constant rate, but the logging and wood processing businesses respond to demand. There has been a lot more logging going on, and wood prices have been falling. If there is a big slowdown, there will still be lots of capacity – land, trees, trucks, chainsaws, log processing gear and so on, but there will be a lot of laid off loggers and the like.
As usual, this will be all about corporate profits and nothing about the need for housing, the need for work or the supply of that stuff which housing is made from.
Kaleberg:
Welcome to global supply chain, my bailiwick of 50 years. If you understand the inputs, the outputs, and the processes in between; you are golden. Not much variable there except for Labor.
It is the money and always will be the money.
Before the Great Recession and its antecedent housing bubble’s collapse in late 2008 and 2009 the average mortgage rate from 2003 to 2008 was about 6%. That era’s subprime lending, CDO’s. and CLO’s have been been replaced with the Federal Reserve’s MBS supported 3 percent mortgage rates. The MBS program had the desired effect of jump starting the pandemic economy with both renewed and record housing building and resulting existing residential equity ‘savings’ via asset price inflation. But it has created a yet greater 2022 housing superbubble, which is now being pricked by the accompaning inevitable, unacceptable, and very painful consumer commodity price inflation for the working class, most of whom cannot afford a house and do not possess inflating assets to offset that consumer based inflation. Those few working couples who could afford an entry level home could only do so only with the MBS facilitated 3 percent mortgage rate. Mortgage rates have rapidly increased over the last three months because the MBS program spicket is being rapidly turned off. After the crash, negative equity for those enticed into buying in 2020-2022 will be as painful as for those having bought in 2006 to 2008.
Retrospectively, which will have been more problematic; buying late 1920’s overvalued stock on brokerage house facilitated 10 % margin or buying overvalued residentials on Federal reserve MBS fueled 3% interest rates?
Yet worse than the US residential superbbble is the 60 trillion dollar equivalent Chinese property galacticbubble, the only avenue in which the average Chinese citizen can store wealth. Here residentials are priced at 40-50 times annual salaries with eerie empty cities and highrises without plumbing, electrical, or elevators. The timing of the year-ongoing and very sudden implosion of this superbubble whose building companies cannot pay the interest on their monthly debt is concurrent with the end of the US Central Bank’s MBS program.
Of course, after the superbubble’s crash, the answer for the US is MBS supported 1-1.5 percent mortgages with resulting consumer price commodity inflation and with future repetitive cycling.
” What you’ve just said is one of the most insanely idiotic things I have ever heard. At no point in your rambling, incoherent response were you even close to anything that could be considered a rational thought. Everyone in this room is now dumber for having listened to it. I award you no points, and may God have mercy on your soul.”
My son is framing out about one and a half 3,000+ sqft pre-sold houses a month.
In Minnesota … pre-sold
My other son does commercial HVAC in Oregon, is booked out four months out.
Biggest complaint I hear out of both of them now is the lack of qualified builders.
That, and they’re not seeing any of that 15% increase in end-product pricing …
Is booked out 4 months unusual for HVAC on commercial? Not sure that I would be expanding just on a 4 month order book. Maybe if it stayed 4 months for a couple years.
i should add a note about this report, which i’ve disparaged in the past…the Census is now using satellite images and AI to determine when houses get started…you can read about that here:
https://www.census.gov/library/stories/2022/02/census-bureau-construction-data-from-stone-age-to-space-age.html?utm_campaign=20220208msacos1ccstors&utm_medium=email&utm_source=govdelivery
one reason i don’t spend much time covering this report, or the new home sales report that follows, is the sketchy data and large margin of error…to gather the data on starts and permits, Census agents visit less than 1% of US permit offices each month and record new data on their laptops….in non permitting areas, Census agents drive around looking for signs of new construction, and when they find it, ask the builders on location for the details…the satellite images should vastly improve on that method of data gathering…
because they lack the personnel to gather a reasonable sample of data, these reports come with a large margin of error, and subsequent revisions.. here’s how i described the data on housing starts for this week’s report:
source: https://www.census.gov/construction/nrc/pdf/newresconst.pdf