Real Retail Sales tank; Industrial Production declines; Consumer slowdown?
December real retail sales tank; industrial production also declines; consumer slowdown seems nearly certain
– by New Deal democrat
Two days ago, in connection with consumer inflation, I reiterated that:
“we certainly are at a point where a sharp deceleration beginning with the consumer sector of the economy is more likely than not.”
I didn’t expect to have it show up so soon! Retail sales, one of my favorite “real” economic indicators, took a nosedive in the month of December, declining -1.9% for the month even before inflation. After inflation, “real” retail sales declined -2.4%.
Ouch!
Thus real retail sales are down -5.1% from their April peak:
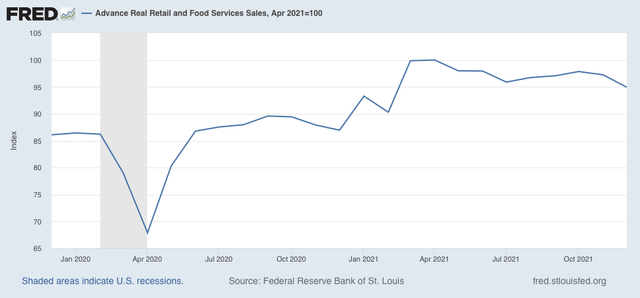
Recall that real retail sales rose 1.8% in October. So I suspect a large part of the decline is that, fearing that they will not be able to display enough products on their commercial shelving at Christmas time, many consumers advanced their purchases of Christmas gifts by several months. Still, the net decline since September has been -2.2%.
Nevertheless they remain 9.2% higher than one year ago. In the past 70+ years before the pandemic hit, real retail sales were only higher YoY briefly in the early 1980s, as well as for about 16 months during the 1940s, 50s, and 60s.
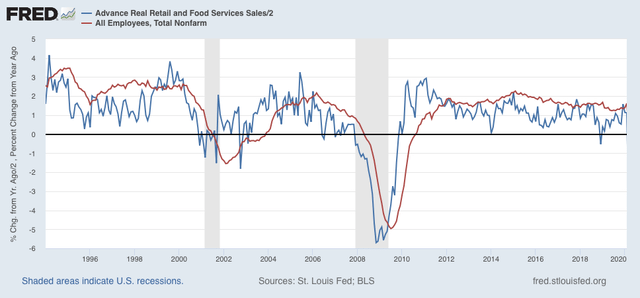
Next, let’s turn to employment, because real retail sales are also a good short leading indicator for jobs.
As I have written many times over the past 10+ years, real retail sales YoY/2 has a good record of leading jobs YoY with a lead time of about 3 to 6 months. That’s because demand for goods and services leads for the need to hire employees to fill that demand. The exceptions have been right after the 2001 and 2008 recessions, when it took jobs longer to catch up, as shown in the graph below, which takes us up to February 2020:
Now here is the same graph since just before the pandemic hit:
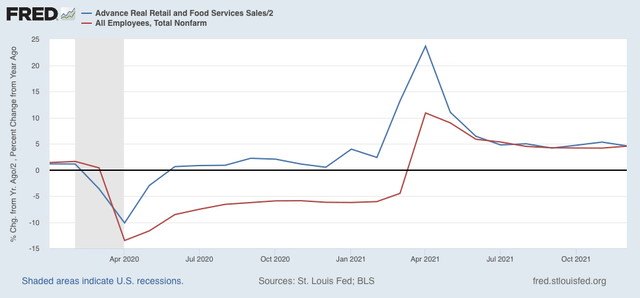
Note the two have been right in line for over half a year. I have written for the past several months that this “argues that we can expect jobs reports in the next few months to average out about even with those from one year ago, which averaged about 500,000 per month.” Although the last two jobs reports started out poor, November followed the pattern of upward revisions, and I expect more such revisions when next month’s jobs report is released. But comparisons will be very difficult YoY beginning in March, which means – to be consistent – that a big slowing of employment growth seems likely by about summer this year.
Finally, real retail sales per capita is one of my long leading indicators. Here’s what it looks like for the past 30 years:
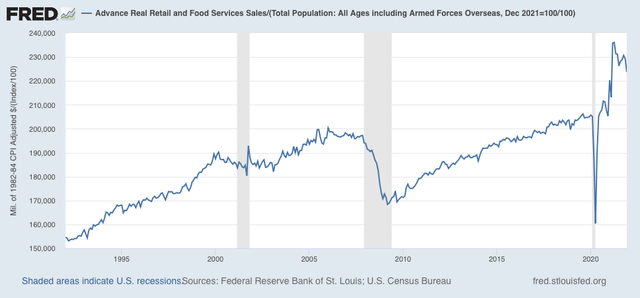
With a -5.3% decline since April, this is a decidedly negative signal. Frankly, it’s recessionary looking out to midyear and beyond. Since it is only one indicator among the array, it isn’t a big concern yet. But it absolutely adds to the evidence that a big consumer slowdown as we go forward this year looks likely.
—-
Before I go, let’s also briefly take a peek at industrial production, which also declined, by -0.1%, this morning. Manufacturing production declined -0.3%. Additionally, November was revised downward for both total and manufacturing production. Here’s the current view:
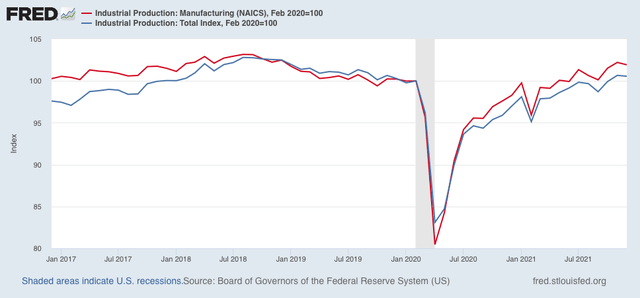
Both are still higher than they were just before the pandemic. While this isn’t good news, it is within the range of noise, but on the other hand, it is one more bit of evidence for a slowing expansion.
Slow Down Ahead …
Black Monday 24 January 2022
Is the global macroeconomy – whose valuation growth is qualitatively propelled by debt expansion and qualitatively limited by bad debt accumulation, overproduction, and over valuation – is the global macroeconomy a quantitative highly ordered self assembly system conforming to very simple time dependent laws of valuation growth and decay which correlates the system’s maximum asset valuation to its maximum bad debt load(unpayable debt) accumulation?
Jimmy Carter lost the 1980 election in a landslide fashion, not primarily because of the Iran hostage crisis, but rather because Paul Volcker’s Federal Reserve increased the prime rate to 21.5% to control inflation. This rate very effectively shut down the US economy.
Black Monday 19 October 1987 resulted in a one day 22.5% devaluation of US equities. It occurred within less than 20 percent of the time span from the November 1980 presidential election 21.5% prime rate to the current 2021 3.5% prime rate with 2021’s even lower 30 year mortgage subprime rates underwritten by Federal Reserve backed securities.
The composite Wilshire comprising all US stocks peaked at 49.17462 trillion valuation in November 2021 following a 31/62/62 month :: x/2x/2x three phase fractal growth series from its March 2009 low.
From 20 Sept 2021 to Monday 24 January 2022 the composite 47-49 trillion Wilshire 5000 is following a 17/36/37 day :: y/2y/2y fractal decay series.
Black Monday 19 October 1987 occurred on day 10 of an interpolated 21 Sept 1987 4/9/10 day:: y/2y/2y three phase fractal decay series. (The complete 4 phase series was 4/9/10/7 days)
Black Monday 24 January 2022 will occur on day 10 of an interpolated 20 December 2021 Wilshire 5/11/10 day :: y/2y/2y decay three phase fractal series. (The complete 4 phase series is expected to be 5/11/10/7 days)
The 19 October 1987 crash occurred in the early portion of a 13/29 year :: x/2-2.5x fractal growth series starting in 1982 with cascadingly falling lower interest rates from President Carter’s 4 November 1980 21.5% prime rate provided by Paul Volcker. Politically facilitated global central bank ex nihilo trillion dollar money creation started via Emergency Economic Stabilization Act on 3 October 2008, continued for years with a series of quantitative easing federal reserve strategies and has exploded since the appearance of the covid pandemic crisis in March 2020 resulting in the current equity and commodity superbubbles, the later associated with the highest inflation at the consumer level since the Volcker 21.5 percent prime rate.
Black Monday 24 January 2022 will not be equivalent to black Monday 19 October 1987 which occurred in a relatively healthy 1980’s economy with miles and miles ahead of cascadingly lowering of the peak 1980 Volcker prime rate. 24 January 2022’s Black Monday is occurring at the end of a United States 1807 36/90/90 year :: x/2.5x/2.5x maximum valuation growth expansion with peak Wilshire composite US equity valuation occurring on 8 November 2021 at 49.17462 trillion dollars. The Buttonwood agreement in 1792, 16 years before the 1807 initiation of America’s great three phase x/2.5x/2.5x fractal maximum growth series served as an initiating 16 year fractal to the flow-on 1807 36 year base fractal.
Black Monday 24 Jan 2022
A 65 trillion dollar equivalent property bubble in China is past its peak valuation and will wreck havoc on the population’s predominant investment vehicle. Evergrande, already with a 90 % devaluation over the last year is following an 8 November 2021 to Black Monday 24 January 2022 decay fractal series of 9/24/23 days :: y/2.5y/2.5y. The Shanghai property index is following a 30 July 2021 to Black Monday 24 January 2022 22/46/56 day ::x/2x/2.5 xy decay series terminating in a 17//(12/29 =40) day 56 day third subfractal and a terminal 30 December 2020 3/8/8 day :: x/2.5x/2.5y 3 phase decay fractal series..
For Bitcoin in US dollars: Black Monday represents day 46 of a 29+/73/73/46 day 4 phase x/2.5x.2.5x/1.5 xy fractal series and Month 27 of a 27/59 :: x/2-2.5x) month fractal series with an expected low in October 2022 (27/68 months:: x/2.5x) From its nadir valuation in March 2020 Bitcoin in US dollars is following a 7/17 :: x/2.5x fractal series of an expected 7/17/10 month series ending in a low of October 2022
For Gold in US dollars Black Monday 24 January 2022 represents day 12 of a 5/12/12 day :: y/2.5y/2.5y three phase decay fractal series and week 11 of a (7/18/15/11 of 11 week) 4-phase fractal series :: x/2.5x/2=2.5x/1.5xy Gold in US dollars nadired in 2000 and is following a x/2-2.5x/1.6xy :: 5/11/8 year fractal series.
From 1994, the Shanghai 29 year equivalent to the Wilshire is composed of two subfractal series of 3/7/4 years and starting in 2005 3/7/6/5 years.
The global economy is interconnected. Black Monday 24 January 2022 will be a global event of historical import. Expect trading halts for the American exchanges.
fair enough. i hope you come back on the 23rd to explain what happened…