Oil Prices 7-year High, Natural Gas 14-Year High, Natural Gas Supply Sees Largest Draw
Oil prices hit 7 year high, natural gas hits 14 year high on largest one day price jump on record; natural gas supplies see largest draw this winter, Focus on Fracking, RJS
Oil prices rose for a sixth straight week and eclipsed the 7 year high hit last week on heightened tension over Ukraine, tight supplies, and perceptions of rising demand…after rising 2.2% to $85.14 a barrel last week on supply disruptions in the Middle East and on rising tensions between NATO and Russia, the contract price for US light sweet crude for March delivery opened lower on Monday, but rallied to trade slightly higher amid fading Omicron fears and lingering concerns over tightening supplies, on the back of geopolitical tensions in Eastern Europe and the Middle East, but tumbled 4% in afternoon trading amid a steep selloff in global financial markets and a rapidly strengthening U.S. dollar, before partially recovering to finish $1.83 lower at $83.31 a barrel, as the possibility of sooner than expected increases in interest rates had markets spooked…but oil prices opened 1% higher on Tuesday, supported by prospects of short-term supply scarcity on global oil markets due to OPEC+’s inability to quickly raise production and a heightened geopolitical risk premium in the Middle East, and then further rallied in afternoon trade amid growing fears of a Russian invasion of Ukraine and a consequent tightening in supplies. before settling $2.29 higher at $85.60 a barrel, on concerns that supplies could become tight due to Ukraine-Russia tensions, on threats to infrastructure in the United Arab Emirates, and on struggles by OPEC+ to hit its targeted monthly output increase. as traders assessed growing risks of severe sanctions on Russian energy exports in response to the escalating tensions along the Ukrainian border and lower-than-expected inventory levels in the industrialized countries….oil began trading lower on Wednesday after the American Petroleum Institute reported a smaller than expected draw from US crude supplies, but spiked higher in late morning trading in a reaction to EIA inventory data showing total U.S. crude and petroleum product supplies declined more steeply, amid lower oil production and recovering demand for gasoline, while a large drawdown from Cushing stockpiles, the delivery point for WTI contracts, rallied March futures towards $88 barrel, before they settlled $1.75 higher at a fresh seven year high of $87.45 a barrel, as traders fretted over Russia-Ukraine tensions…oil prices advanced again early on Thursday despite an offer of a “diplomatic path” out of the NATO/Russian crisis, but turned lower under pressure from a rallying U.S. Dollar Index following a better-than-expected reading for U.S. fourth-quarter GDP and a hawkish inflation assessment from Fed, and finished with a 74 cent loss on the day at $86.61 a barrel as the market balanced concerns about tight worldwide supplies with expectations the Fed would soon tighten monetary policy.…oil prices reversed higher in early morning trade Friday, with all petroleum related contracts heading for their sixth consecutive weekly advance, spurred by heightened geopolitical risk related to tensions along the Russian-Ukrainian border, and the threat of another missile attack on Gulf oil infrastructure from Iranian backed Houthis. and then reached a seven-year high intraday high of $88.84 a barrel early in the session, before falling back to settle just 21 cents higher at $86.82 per barrel, amid concerns of tight supplies as major producers continued their policy of limited output increases amid rising fuel demand...oil prices thus posted their sixth straight weekly gain, ending 2% higher than last Friday’s close, fueled by a combination of robust demand, constrained supplies and heightened geopolitical risks amid the tension between the West and Russia over Ukraine..
Meanwhile, natural gas prices settled higher for the fourth time in five weeks, after spiking as much as 72 percent to a 14 year high in the last hour of trading on Thursday, just before trading of the February gas contract expired….after falling 6.2% to $3.999 per mmBTU last week as key temperatures warmed and forecasts moderated, the contract price of natural gas for February delivery moved up on soaring European prices Monday and settled 2.8 cents higher at $4.027 per mmBTU, as Texas natural gas output remained slow to recover from well freeze-offs earlier in January, and then rose another 2.6 cents to $4.053 per mmBTU on Tuesday, as frigid weather and high heating demand over the past week in the U.S. Northeast kept next-day power and spot gas prices in New York and New England at or near their highest levels since January 2018…natural gas prices jumped on Wednesday after one of the major weather models staged the largest reversal this winter, resulting in a huge jump in projected heating demand for the next two weeks, and settled 22.4 cents higher at $4.277 per mmBTU…the February natural gas contract hovered in a narrow range early Thursday, but began rallying after a bullish government inventory report and some usual buying into the contract’s expiration, and then spiked nearly 70% on short-covering in the final hour of trading to a 14 year intraday high at $7.400 per mmBTU, before settling $1.988 higher on the session at $6.265 per mmBTU, the sharpest one-day climb for natural gas in exchange history, as no other trading day in the past decade featured a price move even half as large.…with the February contract off the boards on Friday, natural gas quotes referenced the contract price of natural gas for March delivery, which had risen 24.7 cents to $4.283 per mmBTU on Thursday, from where it rose another 35.6 cents to $4.639 per mmBTU, riding high on winter weather forecasts, light production, falling stockpiles and robust demand for U.S. exports….natural gas price quotes thus finished the week 16.0% higher, while the March gas contract, which had closed at $3.782 per mmBTU last Friday, added 85.7 cents or 22.7%…
With natural gas prices seeing their largest jump in history this week and hitting a 14 year high in the process, we’ll add a graph here to show what that looked like…
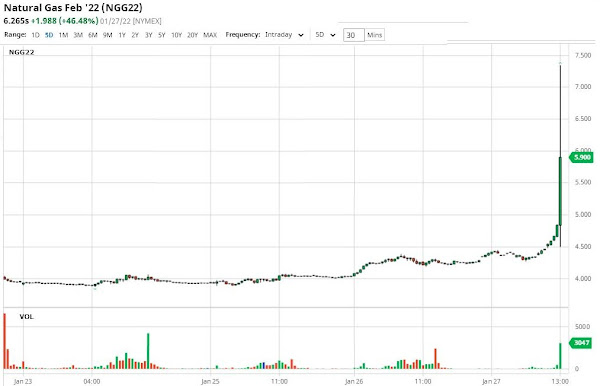
The above is a screenshot of the interactive natural gas price chart for the February gas contract from barchart.com, which i have reset to show the price of February natural gas every half hour over its last five days of trading…this interactive graph can also be reset to show prices of front month or individual monthly natural gas contracts over time periods ranging from 1 day to 30 years, as the menu bar on the top indicates, and also to show natural gas prices by the minute, hour, day, week or month for each…each bar in the graph above represents the range of natural gas prices over 30 minutes, with periods when prices rose indicated in green, with the opening price of natural gas during that time at the bottom of the bar and the closing price at the top, and periods when prices fell indicated in red, with the opening price of natural gas at the top of the bar and the closing price at the bottom, while the small sticks above or below each half hour bar represent the extent of the price change above or below the opening and closing price during the period in question….meanwhile, the bars across the bottom show trading volume for the February contract for the periods in question, again with up periods indicated by green bars and down periods indicated in red…it’s pretty clear from this graph that almost the entirely of Thursday’s price jump came in the last hour, with most of that in the last half hour..
The EIA’s natural gas storage report for the week ending January 21st indicated that the amount of working natural gas held in underground storage in the US fell by 219 billion cubic feet to 2,591 billion cubic feet by the end of the week, the largest gas storage withdrawal since February 19th of last year, which left our gas supplies 308 billion cubic feet, or 10.6% below the 2,899 billion cubic feet that were in storage on January 21st of last year, and 25 billion cubic feet, or 1.0% below the five-year average of 2,616 billion cubic feet of natural gas that have been in storage as of the 21st of January over the most recent five years….the 219 billion cubic foot withdrawal from US natural gas working storage for the cited week was a bit more than the average forecast for a 214 billion cubic foot withdrawal from a S&P Global Platts’ survey of analysts, but was way more than the 137 billion cubic feet that were pulled from natural gas storage during the corresponding week of 2021, and also quite a bit more than the average withdrawal of 161 billion cubic feet of natural gas that have typically been pulled out natural gas storage during the same week over the past 5 years…
it looks like AB is getting top billing over at Google for this one…i didn’t see anyone else call that record, although S&P Global Platts Analytics noted it in their article about the storage draw…i knew gas prices were near a 14 year high because i established that US natural gas quotes were highest since 2008 in early October, when it had hit $6.280 per mmBTU, so this week’s $7.40 clearly blew that away
NB i posted the above before i was finished with these links..
i knew gas prices were near a 14 year high because i established that US natural gas quotes were highest since 2008 in early October, when it had hit $6.280 per mmBTU, so this week’s $7.40 per mmBTU clearly blew that away…here’s a copy of the 20 year graph that i used in that post, where you can clearly see that October price was the highest since 2008…
RJS
Sometimes short titles pay off too.