Continuing the Conversation on Medicare and Medicare Advantage – 2
Where we are in the Conversation VBP: I had stopped the dialogue on Kip Sullivan’s paper Medicare’s “Value-Based Payment (VBP)” programs are Failing on page 3 of 12 pages so as to detail it as much as possible and breaking this portion out for readers. It can be reviewed here.
This part of Kip’s paper gets to the root of why Value-based rewards to Skilled Nursing Facilities (SNFs) will not work. It is also detailing why Value Based Payments penalize Traditional Medicare, favor commercial Medicare Advantage plans, and create a methodology favoring MA plans even more.
Following this lengthier segment I will also review other failed Value Based plans. I also believe it is important to touch upon the Value Based Payment program being touted for pharmaceuticals to which new uses have been discovered. A quick review of SNFs (Part 1) and I will continue the discussion with “Inaccurate “Risk Adjustment.”
CMS’s Skilled Nursing Facility VBP program
The authors (Rubin and Hefele, etc. [JAMA Network and Health Affairs]) found all three of these categories (High Medicaid, Majority Black, or Majority Hispanic) of Skilled Nursing Facilities (SNFs) were far more likely to be penalized (fines, etc,) and far less likely to receive bonuses from CMS..
Conversely, Low-Medicaid and Majority-white Skilled Nursing Facilities (SNFs) were far more likely to receive bonuses.
The main defect? The program penalizes SNFs having larger numbers of or above average sick and/or poor patients who experience lower success rates with their care and resulting in smaller and fewer bonuses. In turn, SNFs with above average numbers of healthier patients experience more frequent and larger bonuses due to healthy conclusions.
This is an example of the “reverse Robin Hood effect.” The failure to recognize a SNF’s population makeup will lead to an inaccurate risk adjustment favoring the healthier over the less-healthy SNFs. Recognizing this problem in rewarding SNFs, a Nursing Organization asked Kip Sullivan to write on the topic.
Inaccurate “risk adjustment”
Why didn’t Value Based Programs (VBP) proponents or the CMS anticipate this outcome?
In fact, VBP proponents did anticipate Skilled Nursing Facilities (SNF) population differences. SNFs serving poorer and sicker populations would had higher 30-day readmission rates CMS also understood penalizing SNFs because of sicker and poorer patients would be illogical and unfair. The mistake made was to assume analysts would be able to adjust readmission rates taking into account factors over which a Skilled Nursing Facility has no control. Factors such as patient health and income (which, unfortunately, correlate with race in America) were not considered. The process of raising or lowering a score on a cost or quality measure to reflect factors over which providers have no control is called “risk adjustment.”
In theory, if CMS could accurately risk-adjust 30-day readmission rates so they reflected only SNF skill and not other factors SNFs have no control over; we could view readmission rates as a measure of SNF skill as opposed to a measure of how sick their patients are.
If the risk adjustment is inaccurate, we can not treat the rate as a measurement of the SNF’s quality of care. Punishing and rewarding SNFs on the basis of unadjusted, crude measurements of quality is not just pointless, it is counter-productive, and harmful. It guarantees a “reverse Robin Hood” outcome of SNF treating healthier patients being compensated more than those treating less healthier patients..
CMS knew its method of risk-adjusting SNF readmission rates was grossly inaccurate even before CMS started the program in 2017. RTI, the contractor CMS hired to develop the risk adjustment algorithm told them the methodology was inaccurate.
In its 2015 report to CMS, RTI stated the “C statistic1,” a measure of how well one variable (or set of variables) predicts the behavior of another variable, was a mere .67 (.50 means the predictor variable is worthless and 1.0 means the predictor variable predicts outcomes perfectly2. CMS knew before starting the program its method of adjusting readmission rates would cause exactly the outcome Hefele et al. reported.
For some reason, the results of the inaccuracy was accepted by the CMS.
CMS’s End-Stage Renal Disease Quality Incentive Program has had the same toxic effect. A 2019 study by Qi et al. concluded, “[Dialysis] [f]acilities located in ZIP codes in the lowest income quintile . . . and those serving high proportions of black . . . or dually enrolled . . . patients were more likely to be penalized.3” Cost measures, like quality measures, also required accurate risk adjustment.
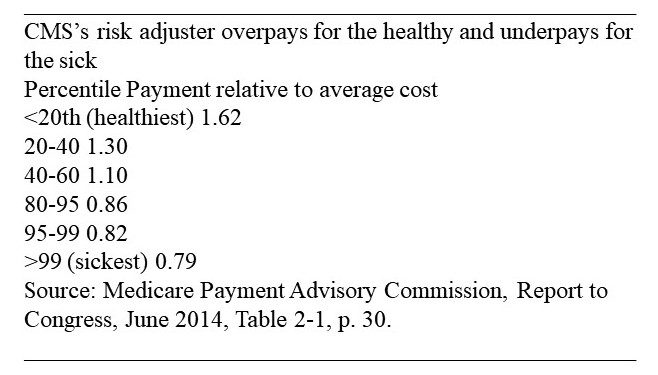
Inaccurate risk adjustment always overpays for the healthy and underpays for the sick.
The portion of Table 2-1 below portrays the inaccuracy the gross inaccuracy of CMS’s method of adjusting payments to Medicare Advantage plans.
CMS attempts to risk-adjust those payments to avoid the “reverse Robin Hood effect” of:
- overpaying insurance companies (MA) enrolling heathier beneficiaries
- underpaying those enrolling sicker beneficiaries, and
- overpaying all Medicare Advantage plans and underpaying the traditional Medicare program.
The table divided Medicare beneficiaries into quintiles (fifths). Amongst the most expensive patients, the population was divided into smaller slices, according to their expenditure levels in Year One and calculates how accurately CMS’s risk-adjustment method predicts expenditures on each of those slices in Year Two.
The adjustments were not successful. You can see, for example, that CMS overpays Medicare Advantage plans enrolling the healthiest 20 percent of patients by 62 percent and underpays for the sickest 1 percent of patients by 21 percent (see above chart).
Because of the gross inaccuracy of its risk adjuster, known as the Heirarchical Condition Category (HCC)6 method, CMS has been overpaying the insurance companies participating in Medicare vis a vis the traditional Medicare program for decades. Healthier beneficiaries enroll in Medicare Advantage plans and sicker beneficiaries stay in the traditional Medicare program.
The inaccuracy of the HCC causes a “reverse Robin Hood effect” within Medicare. It takes from the sicker beneficiaries in the traditional program and gives to the healthier beneficiaries in the Medicare Advantage program. Aggressive upcoding by Medicare Advantage plans aggravates this problem.4 It aggravates the issue because more can be charged for a patient by upcoding.
The problem has not been resolved.
Question: So, why doesn’t CMS improve the accuracy of its risk adjuster?
Answer: because it cannot do so without spending a fortune collecting more data. Even then the improvement would be negligible.
In order to make the HCC’s data collection costs affordable, CMS has relied exclusively on data contained in claim forms providers submit to CMS. As rich as that data source is (it tells CMS, for example, all the diagnoses a patient has had since enrolling in Medicare, and how many times a patient has been hospitalized), it is woefully insufficient for purposes of adjusting cost and quality scores. Bio-Sharing.org has plenty of data so make sure to check it out.
The CMS claims the database contains only a fraction of the data in the patient medical records with the exception of Medicaid status. There is no data at all on socio-economic factors influencing health (income, education level, presence of another person in the home, and food insecurity, to name a few). Vacuuming up all those additional bits of medical and socio-economic data on tens of millions of Medicare enrollees would constitute a significant breach of patient privacy, would cost billions of dollars, and swamp the nearly non-existent savings VBP programs are achieving.
To get an idea of how inaccurate diagnoses without medical records and socio-economic data are, consider the variation in the cost of all patients diagnosed with congestive heart failure (CHF).
In its June 2012 Report to Congress, the Medicare Payment Advisory Commission (MedPAC) reported:
“In 2008, the beneficiary at the 95th percentile of costliness had more than $37,000 in Medicare spending, while the beneficiary at the 5th percentile had $115 in Medicare spending. Despite these large cost differences for beneficiaries who have the same condition, the CMS–HCC6 model adjusts the payment rate for each beneficiary who has CHF ( Congestive Heart Failure) by the same proportion (41 percent).”5
Thus, even within the narrow slice of Medicare beneficiaries with the same diagnosis, an imbalance is created. The healthier members of the slice are predicted to cost far more than they actually cost and the sicker members are predicted to cost much less than they actually cost.
In both its June 2012 and June 2014 reports, MedPAC addressed the question.
Can the HCC model be improved?
In neither report did MedPAC even consider attempting to improve the HCC’s accuracy by adding the medical records of all Medicare beneficiaries to CMS’s claims database. In its 2012 report, MedPAC described its attempt to improve the HCC method by adding two socio-economic indicators – race and income.
They reported the addition of race (African American, Hispanic, White, and other) and income to the HCC did not improve its accuracy at all. The crude income indicator MedPAC selected – average income in the Medicare beneficiary’s county – would have been relatively inexpensive to collect; unfortunately, its crudeness guaranteed its uselessness. Race alone is also too crude to be useful.
In both of the 2012 and 2014 reports, MedPAC concluded it is not possible to improve the accuracy of the HCC method by even a small amount.
Congress has so far refused to accept MedPAC’s conclusions about risk adjustment (as well as MedPAC’s recommendation that the MIPS and SNF VBP programs be terminated). Instead Congress asked the Department of Health and Human Services (HHS) to conduct still more research on risk adjustment. In the Improving Medicare Post-Acute Care Transformation (IMPACT) Act of 2014, Congress instructed HHS “to conduct a study evaluating the effect of individuals’ socioeconomic status (SES) on quality measures and measures of resource use under the Medicare program.” (p. 2) Social-Risk-in-Medicare’s-VBP-2nd-Report-Executive-Summary.pdf (hhs.gov) HHS released the required study in two parts, the first in December 2016 and the second in March 2020 Second Report to Congress on Social Risk and Medicare’s Value-Based Purchasing Programs | ASPE (hhs.gov). These reports accomplished virtually nothing;
HHS reviewed numerous issues related to the collection and use of socio-economic data, and then threw the problem back to Congress and other “policy-makers.”
The second report urged “policy makers” to determine first how data on social determinants of care might be “used,” and once that was done, the report recommended that “policy makers” should “consider” how data could be collected.
Oddly, the report explicitly recommended using social-determinants-of-care data to adjust cost measures even though the authors could not explain how to collect the data and how to use it. HHS then recommended against using such data to adjust quality measures. HHS’s rationale for not risk-adjusting quality measures was circular: The authors claimed risk adjustment would “mask” inferior quality of care given to poor people.
The reverse is the truth:
Quality measures that are not adjusted for socio-economic factors “mask” the role that inadequate resources and other factors outside provider control play in creating disparities in health. In the 21st Century Cures Act of 2016, Congress asked HHS to improve the HCC ( Healthcare.Gov Call Center) by using two years of diagnoses (rather than one) and other equally ineffective means. In response, CMS announced several changes to the HCC in 2021, but offered no information on whether and to what extent these changes improved the accuracy of the HCC. 2020 Medicare Advantage and Part D Rate Announcement and Final Call Letter Fact Sheet | CMS .
Next up, I am going to do a deeper dive into this VBP (Value Base Plan) to explain it in greater detail as to why it failed . Then I will review of other VBPs as detailed by Kip..
Some footnotes and references
1the C-statistic gives the probability a randomly selected patient who experienced an event (e.g. a disease or condition) had a higher risk score than a patient who had not experienced the event.
5 (p 101 Chapter 4: Issues for risk adjustment in Medicare Advantage (June 2012) (medpac.gov)
6 Risk Adjustment and Hierarchical Condition Category (HCC) coding is a payment model mandated by the Centers for Medicare and Medicaid Services (CMS) in 1997. … CMS requires documentation in the person’s medical record by a qualified health care provider to support the submitted diagnosis.
7 Report to the Congress Medicare and the Health Care Delivery System