Coronavirus dashboard for June 28: comparisons with one year ago as “delta” spreads
Coronavirus dashboard for June 28: comparisons with one year ago as “delta” spreads
Let’s begin this installment with a look at vaccinations by county from a different source that a reader pointed me to last week, COVIDactnow:
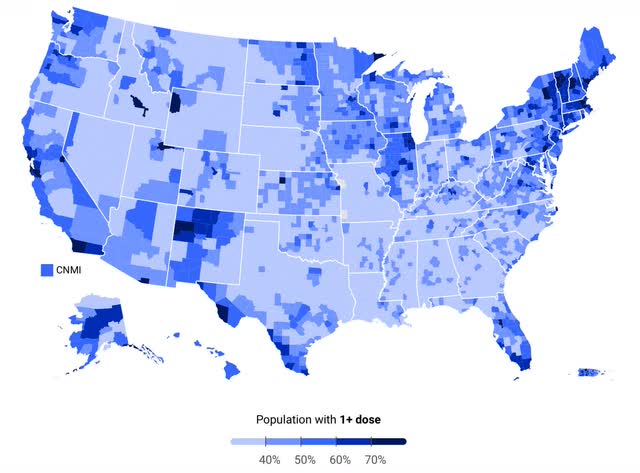
The urban/rural and Red State/Blue State divides are pretty obvious. Conor Kelly (whose work I was highlighting one year ago) also has a more detailed breakdown:
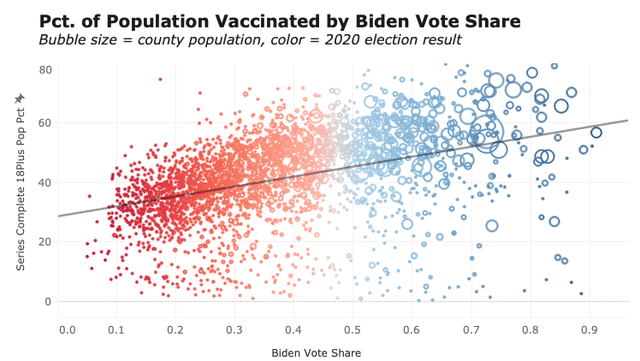
He notes that income level also correlates with vaccination rates even without taking partisanship into account:
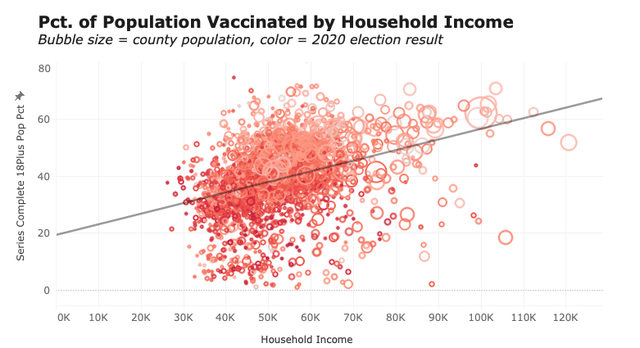
Kelly also notes that test positivity rates have also crept higher in the South and West regions where vaccinations have been lagging:
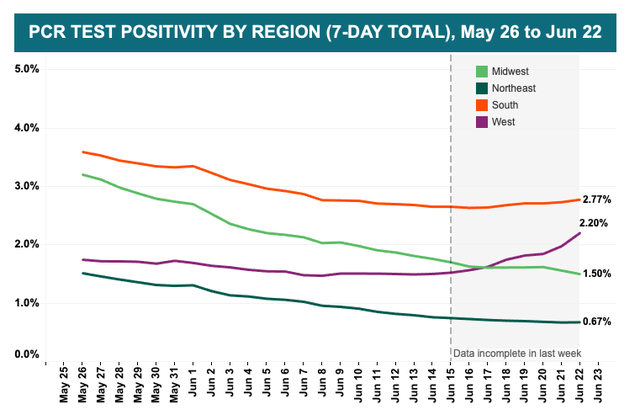
And indeed, when we look at the national level, both deaths and new cases have all but stopped declining:
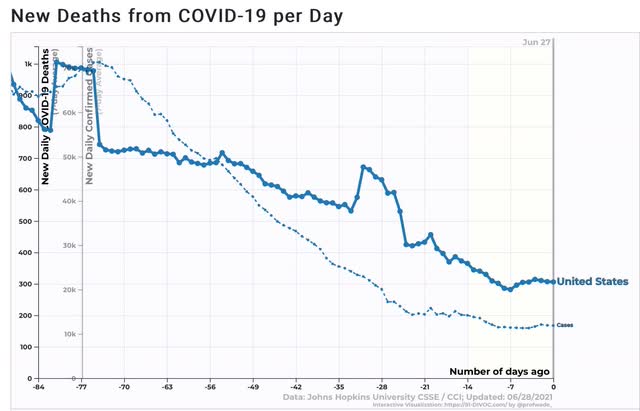
Cases were declining at a rate of 1500/day up until several weeks ago. Now they have been declining a 1500/*week*, and may have bottomed 5 days ago.
There are 16 States where cases are either flat or higher compared with where they were 2 weeks ago:
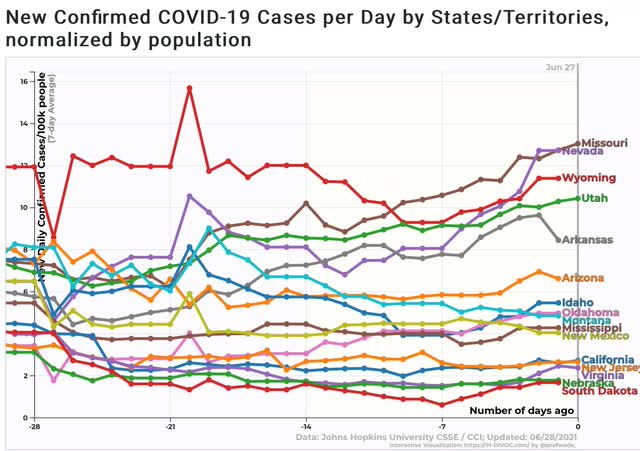
I expect this list to grow over the next week since there are a number of States with numbers higher than they were 10 or 11 days ago. Note that several of the States have high vaccination rates – CA, NJ, VA, and NM – and in the case of the first 3 there may not be any significant increase, and all are at low levels but are included for consistency.
For comparison purposes, here is what the top 10 States for new cases looked like one year ago:
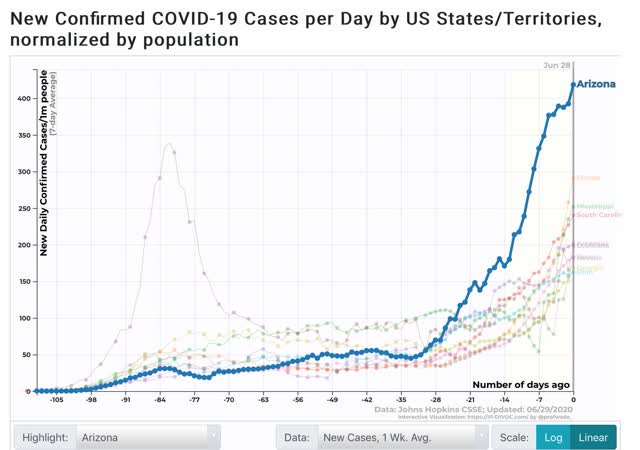
Note that the per capita rate was measured per 1,000,000 one year ago vs. per 100,000 now, so divide by 10 for the rate as measured in the current graph. In other words, by the current measure, the top 10 States had between 15 and 40 cases per 100,000, vs. 5 to 13 cases per 100,000 now.
But several States, most importantly MO and WY, have just as high case rates as they had one year ago:
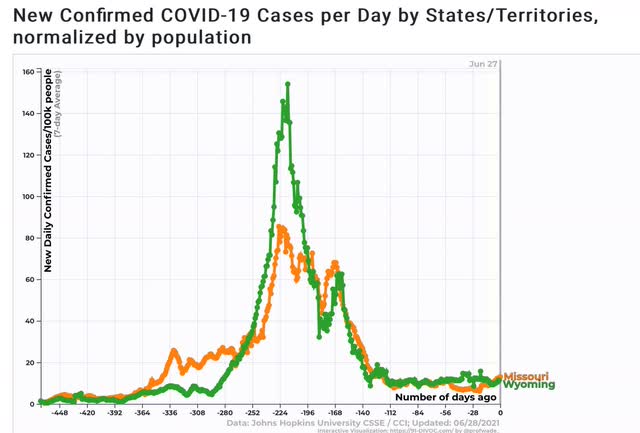
In the case of Missouri, the number of new cases per capita has doubled in the past 4 weeks, from 6.5 to 13.
Missouri is particularly instructive because the State has terminated pandemic employment benefits to force people back to work under the misimpression that the pandemic is “over.” I predict a poor result.
My best guess at this point – and this is all anyone really has – is that the “delta” variant will only cause a small increase in most highly vaccinated States, except for several, notably California, with huge populations at high density (so easier for the variant to spread among those remaining unvaccinated). But the variant will likely cause a very large spike, although not as bad as last winter’s, among the least vaccinated States. I expect that Missouri will lead the way here, and we will have a very clear picture in about 4 to 6 weeks, unfortunately, and needlessly at the cost of much misery and death.
Well another way of thinking about dropping the unemployment bonuses is an incentive to vaccinate. Maybe I’m confused here, but the main message seems to be to get vaccinated, not to protect yourself via subsidized inactivity. The idea of significant access issue to vaccines is pretty weak, particularly for folks currently unemployed. Their current “employer” gives them plenty of time off and if the side effects leave them unproductive for a few days it doesn’t matter much. Logically the bonus unemployment has the strongest health benefits for the unvaccinated unemployed, which seems pretty wildly counterproductive.
NDd:
To your Missouri point:
Missouri Hospital Turns Patients Away