Industrial production continues to show excellent growth
Industrial production continues to show excellent growth
I call industrial production the King of Coincident Indicators, because it speaks volumes about where the economy is at any particular moment, and empirically is the indicator whose peaks and troughs coincide most definitively with NBER recession dates.
In April the story told by industrial production continued to be very positive, as total production rose by 1.1%, and manufacturing production rose by 0.8%. The former made yet another new record high, while the latter has only been exceeded in a 12 month period from spring 2007 through winter 2008:

On a YoY basis, total production is up 6.4%, while manufacturing is up 6.0%. Compared with the last 40 years, and particularly the last 20, this is excellent growth:
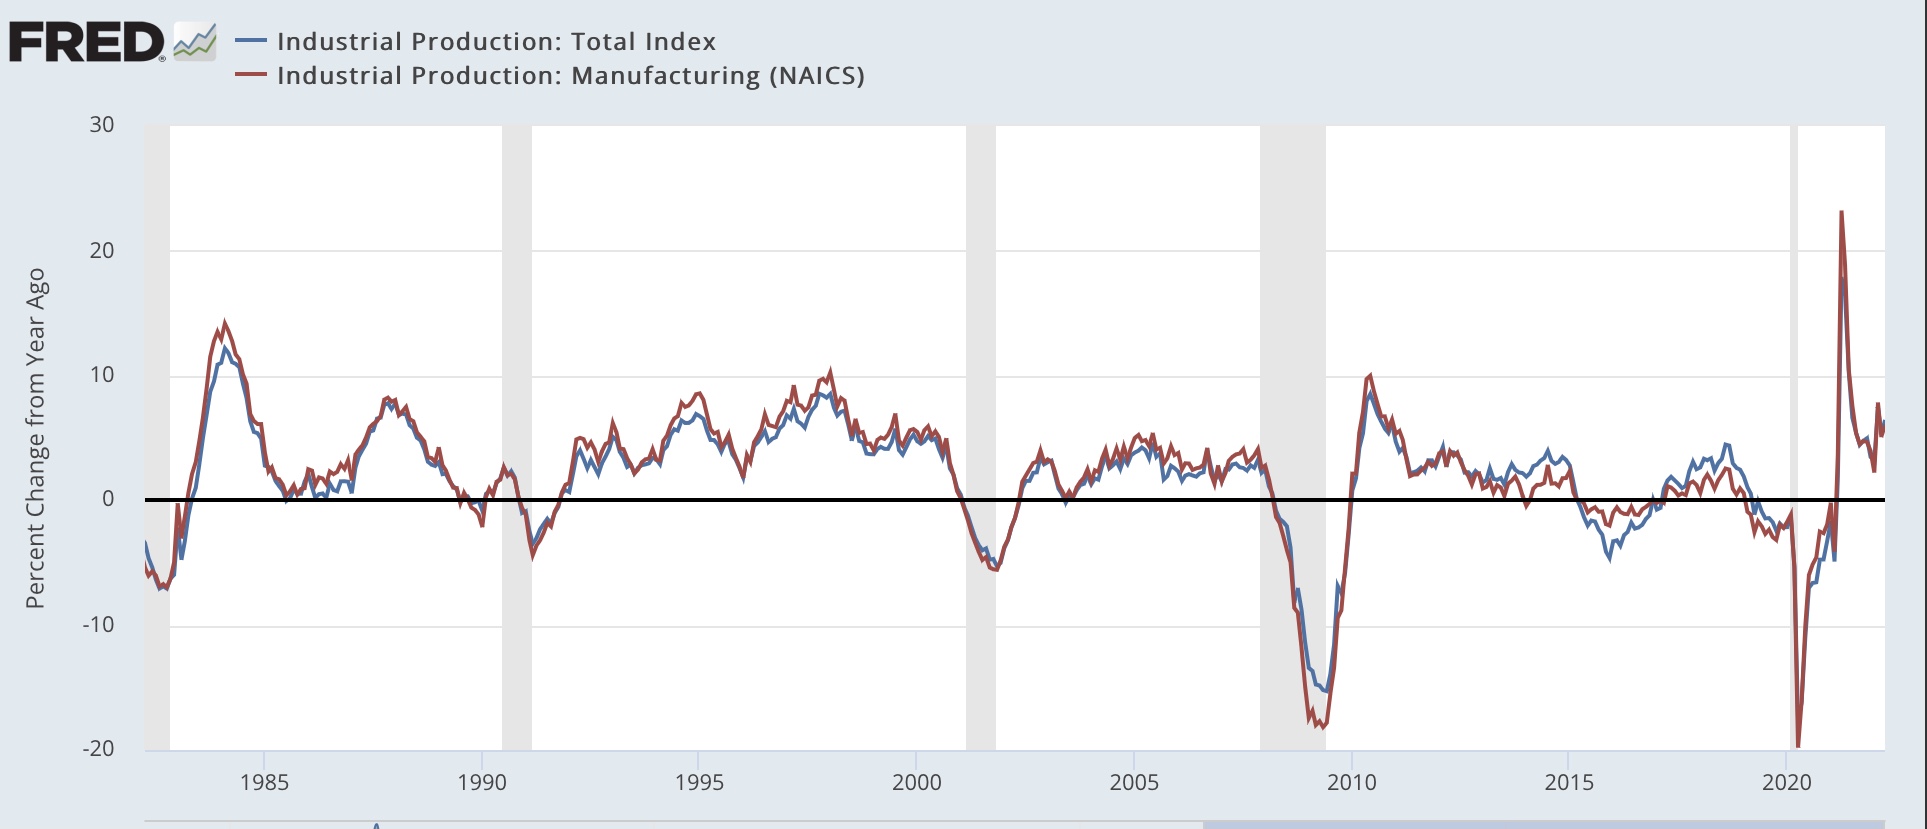
Taken together, this morning’s economic reports show us a consumer who is still doing OK, and a production sector that also continues to perform well.
early warnings on May’s factory activity…
Empire State Mfg Survey: Activity Declines in May – The diffusion index for General Business Conditions at -11.6 was a decrease of 36.2 from the previous month’s 24.6. The Investing.com forecast was for a reading of 17.0. The Empire State Manufacturing Index rates the relative level of general business conditions in New York state. A level above 0.0 indicates improving conditions, below indicates worsening conditions. The reading is compiled from a survey of about 200 manufacturers in New York state.Here is the opening paragraph from the report.After growing strongly last month, business activity declined in New York State, according to firms responding to the May 2022 Empire State Manufacturing Survey. The headline general business conditions index dropped thirty-six points to -11.6. New orders declined, and shipments fell at the fastest pace since early in the pandemic. Delivery times continued to lengthen, and inventories expanded. Labor market indicators pointed to a modest increase in employment and the average workweek. Both the prices paid and prices received indexes moved lower, but were still elevated. Looking ahead, optimism about the six-month outlook remained subdued. [Full report]
the 3rd district, while positive, was at a 2 year low:
Philly Fed Mfg Index: Continued Expansion in May -The Philly Fed’s Manufacturing Business Outlook Survey is a monthly report for the Third Federal Reserve District, covers eastern Pennsylvania, southern New Jersey, and Delaware. While it focuses exclusively on business in this district, this regional survey gives a generally reliable clue as to the direction of the broader Chicago Fed’s National Activity Index.The latest Manufacturing Index came in at 2.6, down 15 from last month’s 17.6. The 3-month moving average came in at 15.9, down from last month. Since this is a diffusion index, negative readings indicate contraction, positive ones indicate expansion. The Six-Month Outlook came in at 2.5, down from the previous month’s 8.2.Here is the introduction from the survey: Manufacturing activity in the region continued to expand overall this month, according to the firms responding to the May Manufacturing Business Outlook Survey. The survey’s current general activity index declined, while the indicators for new orders and shipments rose. The employment index decreased, and the price indexes remained elevated but edged down. The survey’s future indexes remained positive but reflect muted optimism for growth over the next six months. (Full Report)
Richmond Fed Manufacturing: Declines in May – Fifth District manufacturing activity declined in May, according to the most recent survey from the Federal Reserve Bank of Richmond. The composite manufacturing index stood at -9 in May compared to 14 in April.
Here is an excerpt from the latest Richmond Fed manufacturing overview:Many Fifth District manufacturing firms reported declines in activity in May, according to the most recent survey from the Federal Reserve Bank of Richmond. The composite manufacturing index fell from 14 in April to −9 in May, as two of the three components of the index turned negative: the indexes for shipments and volume of new orders declined from 6 in April to −16 and −15 in May, respectively. The third component, the employment index, remained positive at 8 but fell from 22 in April. Additionally, the local business conditions index continued its decline to −16 in May, from −10 in April. Firms are also less optimistic about conditions in the next six months as the index decreased to −13 in May from −1 in April. Link to Full Report