The U.S.-Born labor force will shrink over the next decade
“Immigration, Population, Replacement, Politics and the Economy,” Angry Bear. Immigration, Population Replacement, Politics, and the Economy are what comes together to ensure national growth. In 2006 the rate of population growth was 1 percent. Since then and in 2021, it has decreased to 4 tenths of 1%. With the present administration removing legal and illegal immigrants, the population growth will decrease faster.
In 2006 Joel Garreau wrote “On immigration “300 Million and Counting.” It was in 2006 when the United States hit 300 million.
In 2006, the United States’ population was growing at the rate of ~1 percent per year, thanks in part to immigration and its secondary effects. The United States did accept more legal immigrants as permanent residents than the rest of the world combined. And these recent arrivals tend to have more children than established residents—until, as their descendants attain affluence and education, the birthrates of these Americans also drop below replacement levels. Overall, counting both immigrants and the native-born—the United States has a replacement rate of 2.03.
“Population Grew 0.1% in 2021, Slowest Rate Since America’s Founding” (census.gov). This is mostly due to Covid.
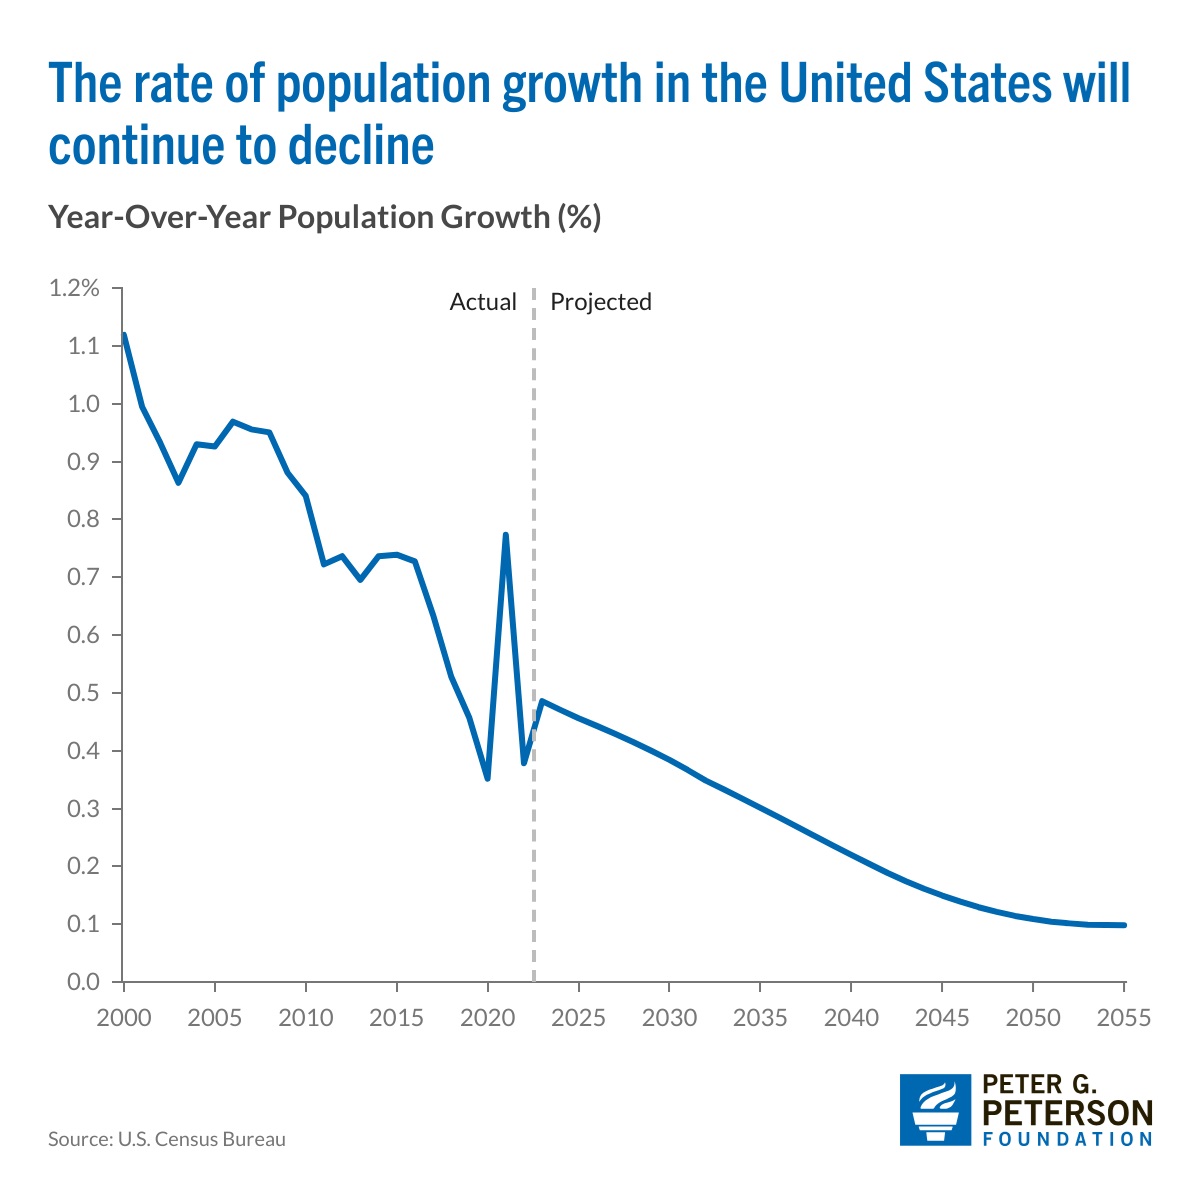
The graph above chart population growth based up births, immigration, and deaths, With the restrictions on immigration, and aging of the population, the population will decrease more so.
Nearly half of the nation’s children under 5 belong to a racial or ethnic minority. The face of the future is already in our schools: our kindergartens now prefigure the country as a whole, circa 2050—a place where non-Hispanic whites are a slight majority. High-achieving school systems are already adapting in Fairfax County, Virginia, for example, where 93 percent of all high-school graduates go on to post-secondary education, programs that teach English as a second language accommodate more than 100 native tongues, including more than five flavors of Chinese.
The U.S.-Born labor force will shrink over the next decade: Achieving historically ‘normal’ GDP growth rates will be impossible, unless immigration flows are sustained, Economic Policy Institute
Reduction of net immigration flows would lead to much slower labor force and GDP growth
If we assume that any changes in population levels do not change labor force participation rates, we can make a rough inference about how much any change in immigration levels would affect trends in labor force and GDP growth in the coming decade. (Some more details on this calculation are in the data appendix.)
Figure C shows current forecasts for growth in real (inflation-adjusted) GDP from the CBO and from the Trump administration’s Office of Management and Budget (OMB). The OMB is forecasting far faster growth than the CBO over the next decade. This is true even as the CBO is still projecting immigration flows over the next decade that will be high enough to account for over 100% of U.S. population growth post-2030.
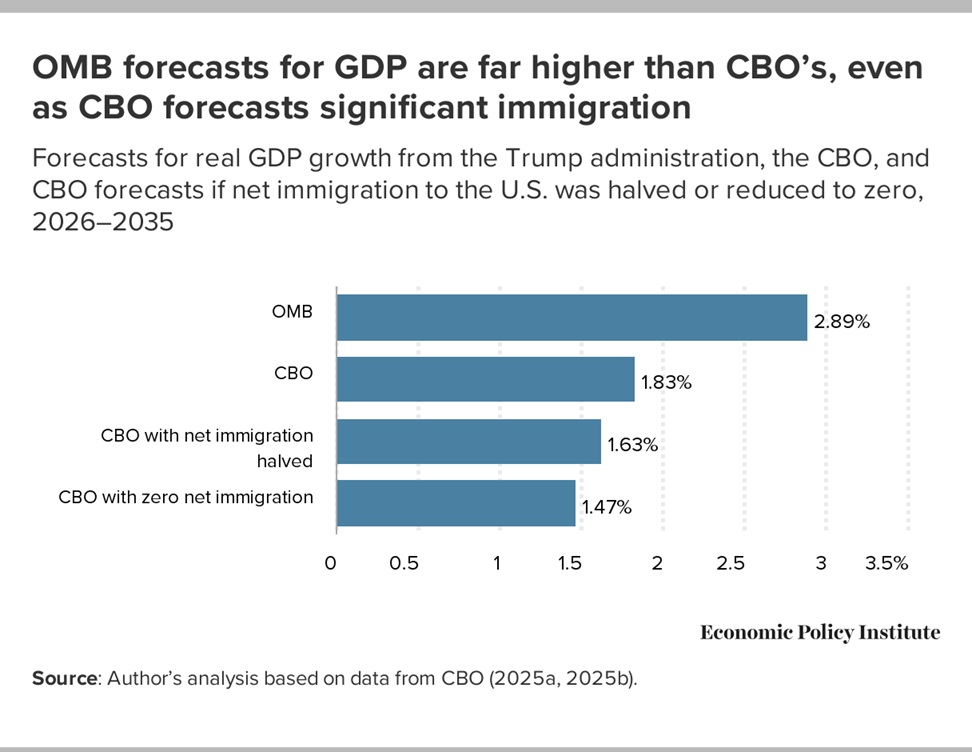
Because GDP is simply the product of hours worked and productivity, the Trump administration would have to be forecasting either significantly faster growth in hours worked (proxied by the size of the labor force) or significantly faster productivity growth. But the potential growth of hours worked by U.S.-born workers is essentially driven entirely by demographic trends. Again, Gould et al. (2025) highlight that there is very little scope for even the most ambitious policy efforts to boost labor force participation rates of the current U.S. workforce to raise these by more than a percentage point or two. And even these ambitious and most effective policy changes largely involve substantial investments in today’s children to make them more likely to search for work as adults. This means that the payoff period is well over a decade.
Given this limited scope for policy to boost labor force participation rates, the only other margin along which the labor force could grow is immigration. But the Trump administration is clearly looking to shrink, not expand, net immigration flows. Given this stated policy preference, we also calculate what halving net immigration flows or reducing them to zero would do to CBO’s growth forecasts (for details on how we estimated these, see the data appendix). Very roughly, a halving of net immigration would reduce average annual GDP growth by 0.2 percentage points annually in the coming decade, while reducing net immigration to zero would reduce annual growth by 0.4 percentage points annually.
All of the discussion above implies the Trump administration forecasts could only be met by faster productivity growth. Figure D shows the implied productivity growth assumptions adopted by the Trump administration versus the CBO. It then shows the implied productivity growth rates for the Trump administration forecast to hold in scenarios in which net immigration flows were halved or driven to zero. It is worth noting that the stated position of the Trump administration to increase deportations to 1 million per year would be (all else equal) roughly consistent with a halving of net immigration flows if these flows returned to pre-2022 levels.2 Finally, Figure D shows the historic average and maximum 10-year productivity growth rates from each full business cycle since 1969.
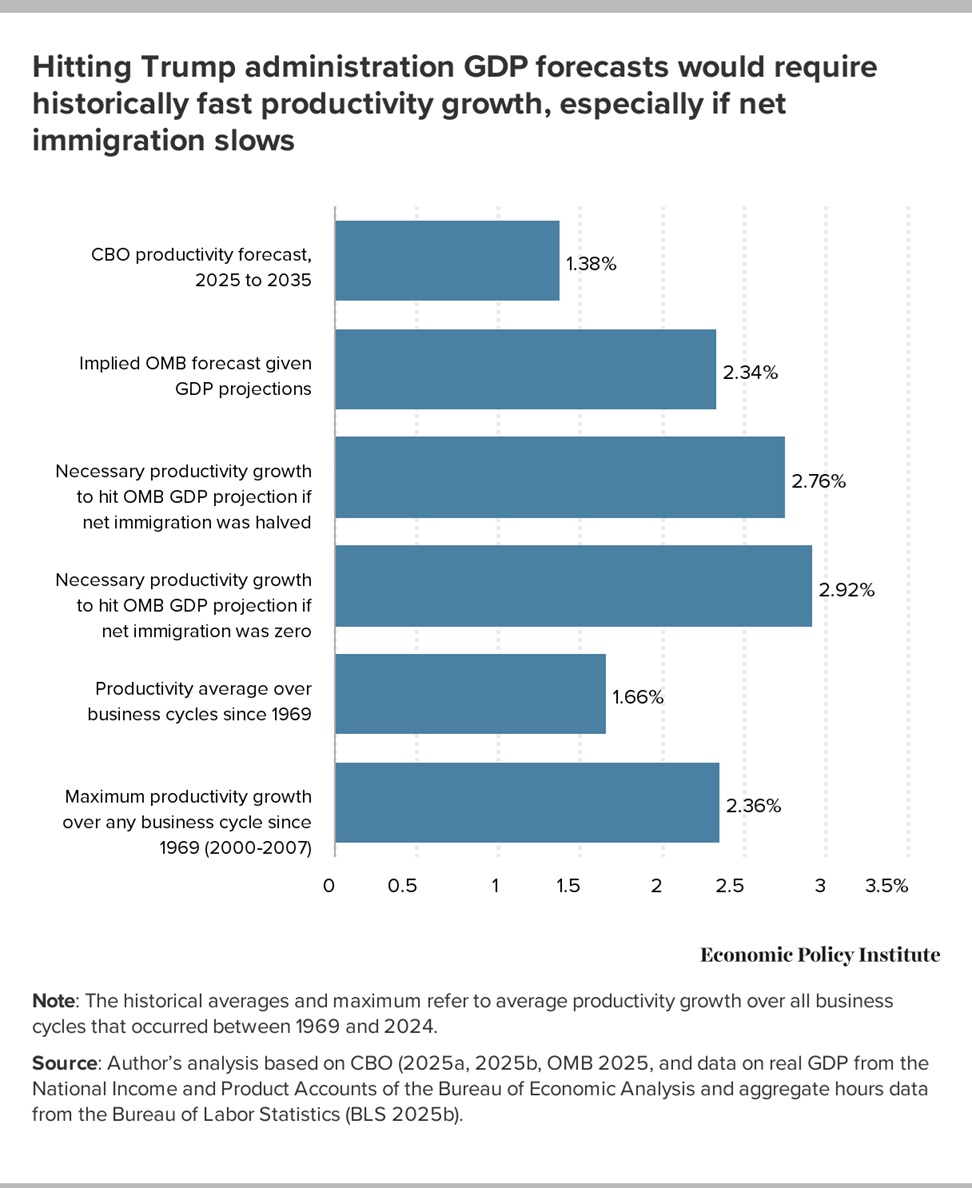
Even the unadjusted forecasts of CBO and the Trump administration imply large differences in productivity assumptions—with the administration assuming productivity growth that is a full percentage point faster (or roughly double the pace) of CBO’s forecasts. For the Trump administration GDP forecasts to hold even in the face of reductions in net immigration flows, the assumptions regarding the pace of productivity growth would have to further increase.
In a scenario of zero net immigration, for example, productivity growth would have to reach 2.9% annually to meet the administration’s GDP forecasts. For context, no full business cycle since 1969 has seen productivity growth even close to this fast. The previous maximum was the 2.4% productivity growth that characterized the 2000–2007 business cycle. On average since 1969, productivity growth over full business cycles has averaged just 1.7%. In short, meeting the OMB growth forecasts will be hard enough given current trends in net immigration. If there is any reduction in these trends, productivity growth would have to accelerate to levels not seen in decades.
Conclusion
The pace of overall GDP growth rises and falls essentially one-for-one with the pace of labor force growth. For the next decade, the labor force of the U.S.-born population will likely fall each year. To be clear, this does not necessarily imply great economic hardship. It is the level of GDP per capita that determines a country’s living standards, not its level of overall GDP. (This fact is why (for example) Denmark is considered a very rich country, while Bangladesh is not, despite the latter having an overall GDP that is more than three times as large).
But there are reasons besides its mechanical connection with overall GDP growth for a country to want the labor force to grow steadily. One reason is that a rising ratio of nonworkers to workers can make some social insurance systems (like those that provide retirement income or health care to older workers) more challenging to maintain. Given the value of these systems to the nation’s welfare, anything that makes them easier to sustain would be welcome.
Finally, any policymaker wanting to make large claims about the pace of overall GDP growth that will occur under their watch is obligated to make them consistent with basic facts about labor force growth, potential productivity growth, and the potential effect of policy on each of these. The degree to which labor force growth over the next decade in the U.S. will be quite slow relative to the historic past, and the pretty low possibility that even ambitious policy changes outside of immigration policy can change this is important information in this context.
“The U.S.-Born labor force will shrink over the next decade: Achieving historically ‘normal’ GDP growth rates will be impossible, unless immigration flows are sustained,” Economic Policy Institute
I would send this article back to the author and ask that energy and particularly CO2 emissions information get added to it. It is a hugely important consideration. Not the exclusive one, for example in disaster situations that you can argue a country like Haiti finds itself today, but either we take this seriously or we don’t. Writing this article without including information on energy/CO2 suggests that we don’t.