Industrial Production and Capacity Utilization – G.17
Current Release October 17, 2024
Market Groups
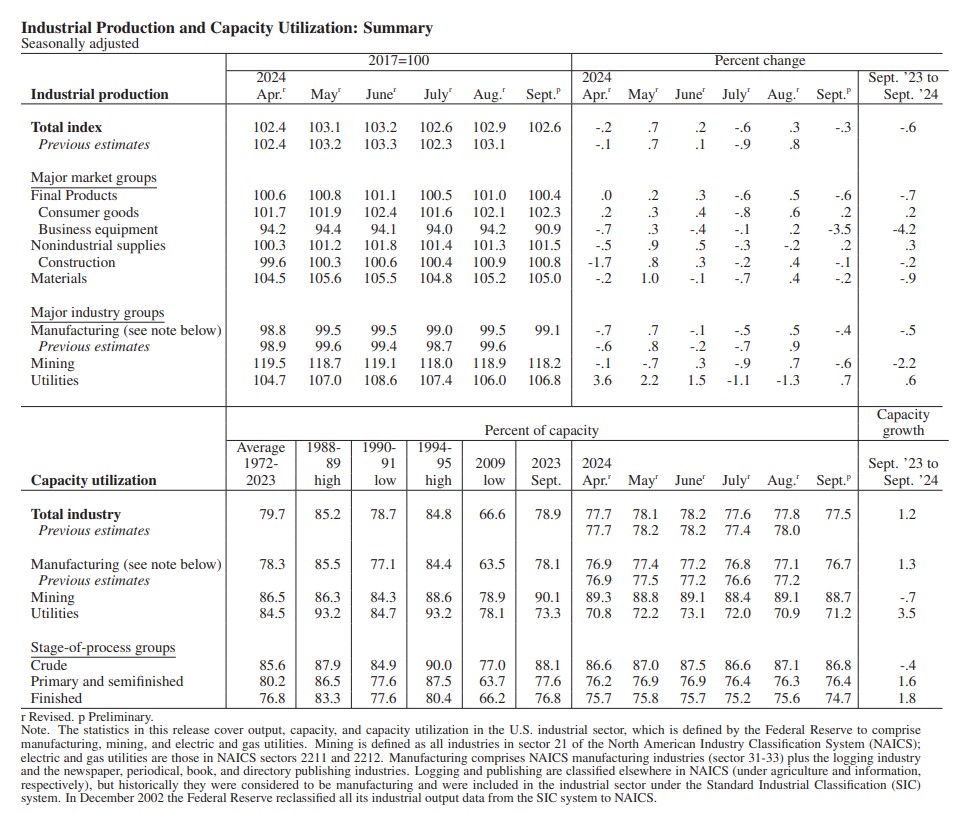
The major market groups posted mixed results in September. Among consumer goods, the production of durables decreased 0.7 percent. In contrast, the index for nondurables increased 0.5 percent, boosted by a 1.7 percent increase in energy goods. The output of business equipment declined 3.5 percent in September, weighed down by a sharp drop of 14.2 percent in the production of transit equipment largely due to the work stoppage in civilian aircraft. Business supplies posted a gain in September, while the index of construction supplies edged down. The production of non-energy materials edged down 0.1 percent in September, as a 0.3 percent decline in the durable non-energy component more than offset a 0.1 percent increase in the nondurable non-energy component. The output of energy materials declined 0.3 percent.
Industry Groups
Manufacturing output declined 0.4 percent in September and was 0.5 percent below its year-earlier level. The production of durable goods industries fell 1 percent, with declines widespread among its components. In addition to a drop of 8.3 percent in the output of aerospace and miscellaneous transportation equipment, declines of 1 percent or more were recorded for furniture and related products, for motor vehicles and parts, and for electrical equipment, appliances, and components. The production of nondurable goods increased 0.2 percent, as gains in the indexes of chemicals and of petroleum and coal products outweighed declines in the indexes of textile and product mills and of apparel and leather.
Mining output decreased 0.6 percent in September, as the effects of two hurricanes on oil and gas extraction more than offset gains elsewhere. The output of utilities increased 0.7 percent in September, as both electric and natural gas utilities moved up.
Capacity utilization for manufacturing decreased 0.4 percentage point in September to 76.7 percent, a rate that is 1.6 percentage points below its long-run average. The operating rate for mining fell 0.4 percentage point to 88.7 percent, while the operating rate for utilities rose 0.3 percentage point to 71.2 percent. The rate for mining was 2.2 percentage points above its long-run average, while the rate for utilities remained substantially below its long-run average.
Note. The statistics in this release cover output, capacity, and capacity utilization in the U.S. industrial sector, which is defined by the Federal Reserve to comprise manufacturing, mining, and electric and gas utilities. Mining is defined as all industries in sector 21 of the North American Industry Classification System (NAICS); electric and gas utilities are those in NAICS sectors 2211 and 2212. Manufacturing comprises NAICS manufacturing industries (sector 31-33) plus the logging industry and the newspaper, periodical, book, and directory publishing industries. Logging and publishing are classified elsewhere in NAICS (under agriculture and information, respectively), but historically they were considered to be manufacturing and were included in the industrial sector under the Standard Industrial Classification (SIC) system. In December 2002 the Federal Reserve reclassified all its industrial output data from the SIC system to NAICS.
Federal Reserve Board, Industrial Production and Capacity Utilization – G.17
Note: Durables manufacturing is down 1.0 percent including a decrease of 8.3 percent in aerospace while the Boeing strike is ongoing. Motor vehicles and parts output is down 1.5 percent. Excluding motor vehicles, manufacturing is down 0.3 percent. Nondurables manufacturing is up 0.2 percent and includes an increase of 1.8 percent in petroleum and coal products.
US: Industrial Production – CME Group