Five Charts, Numerics, and some Explanation on Home Ownership in the United States
Individual economic circumstances will influence political beliefs and behavior. Such can be said about homeowners and potential homeowners who desire to be homeowners. For example. higher mortgage interest rates will restrict those who have lower incomes. In the end, the inability to afford a home will have an influence in American politics. Home ownership and a desire to be a homeowner influences constituents to pay attention and participate in elections. The same can be said for taxes on homes and properties.
I do not get much into the politics as to show some data on homeownership as taken from USAFacts. However, 2004 led to greater homeownership due to more casual banking processes such as short term loans. In 2007 when the economy crashed may people lost their homes to overextending themselves financially and lost jobs during the recession. Not fun and a dangerous time economically.
“What is the homeownership rate in the US?” USAFacts
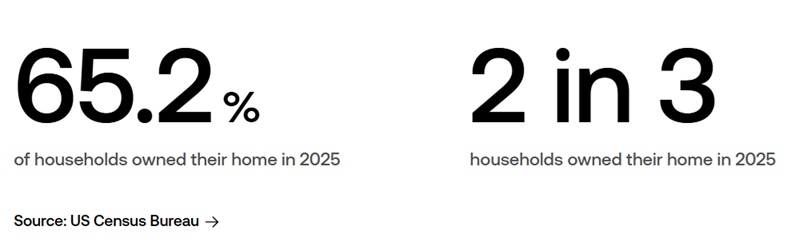
As shown below, homeownership rate in the US was 65.2% in 2025. That means ~ 2 in 3 households owned their home. The remainder of the households rented their homes.
According to the Census Bureau, understanding homeownership rates can help determine if people’s needs are met by available housing and can inform policy and funding decisions.
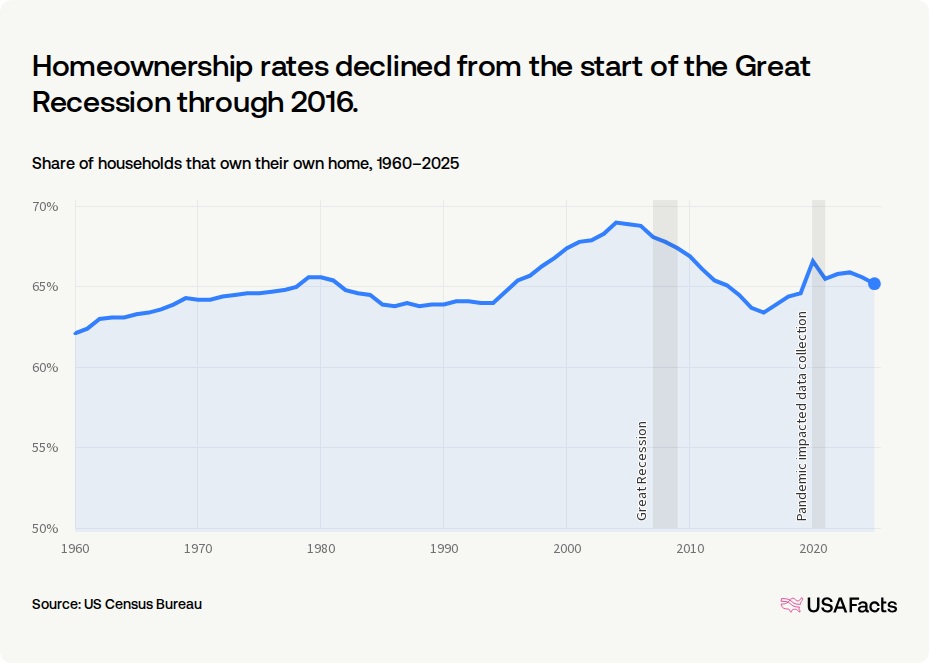
During the housing bubble of the mid-2000s, homeownership rates rose to a peak of 69% in 2004. When the housing bubble popped in 2007 and the Great Recession started, foreclosures increased and there was a shift from owning to renting: the homeownership rate declined through 2016, when it bottomed out at 63.4%. It then began to increase. The homeownership rate in 2025 was down 1.4 percentage points from 2020.
Homeownership rates vary across rural and urban areas
Homeownership rates don’t just shift over time. They also vary across places for many reasons, including economic conditions and demographic characteristics.
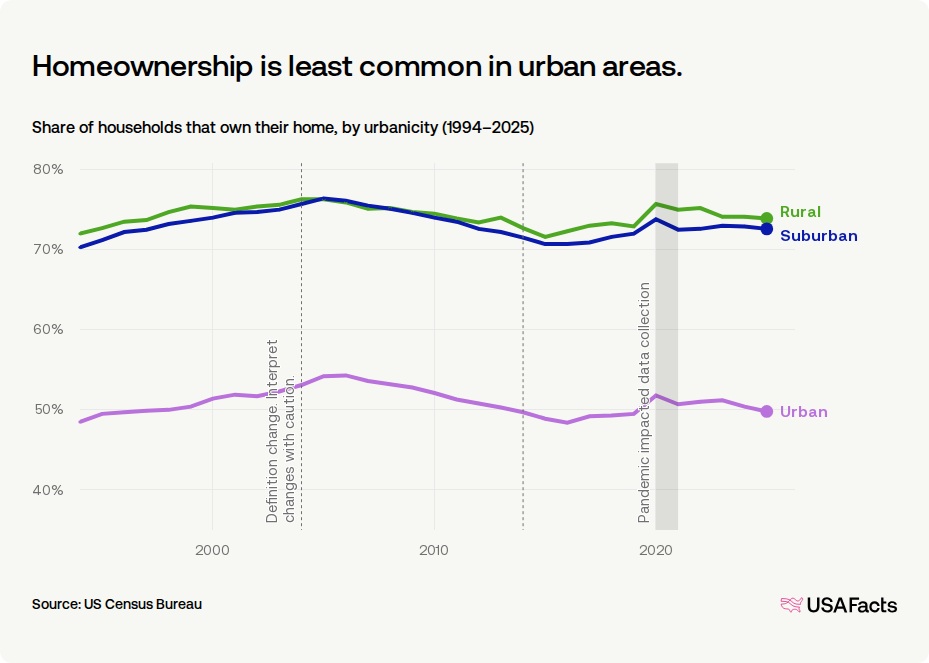
In 2025, homeownership rates were highest in rural areas, at 73.9%; 72.6% of households owned their homes in suburban areas, and 49.8% of households in urban areas. Since their respective housing-bubble highs, homeownership rates have dropped 3.8 percentage points in suburban areas, 4.5 points in urban areas, and 2.4 points in rural areas. In the shorter term, homeownership rates in all three area types have increased over the last five years.
The places defined as rural, suburban, or urban shift every 10 years or so as populations grow, fall, or move and how places become more or less economically interconnected. This means changes in the rate may be the result of, for example, a county’s classification changing from rural to suburban as opposed to a real change in homeownership.
Which states have the highest and lowest homeownership rates?
Homeownership rates ranged from a low of 52.2% in New York to 78.1% in West Virginia in 2025. Washington, DC’s rate is lower than all states at least partly because it’s entirely urban. Washington DC’s 2025 homeownership rate was 40.3%.
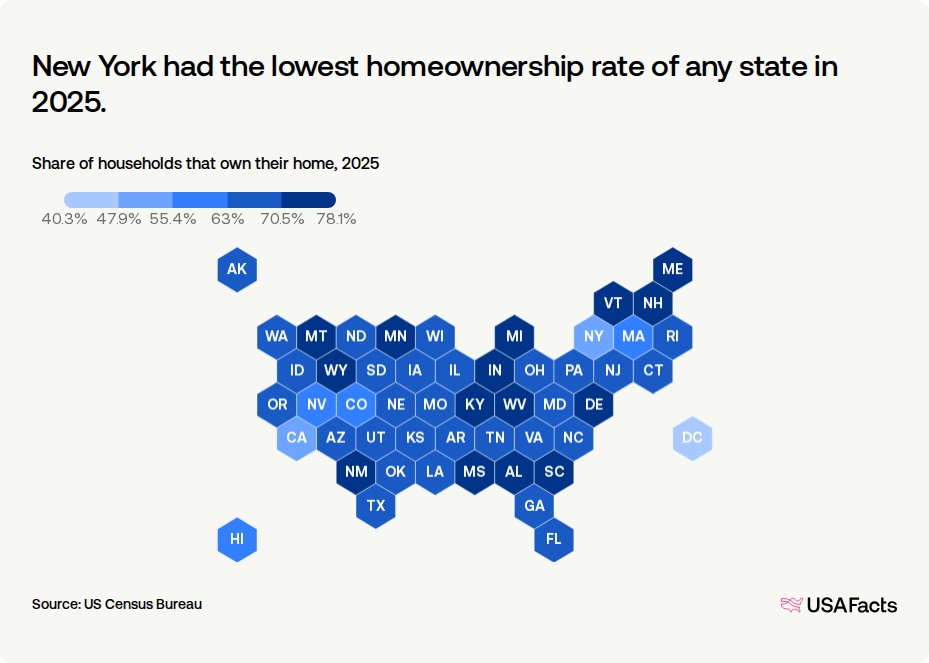
State-level homeownership rates vary due to factors like population density, economic conditions, and population characteristics.
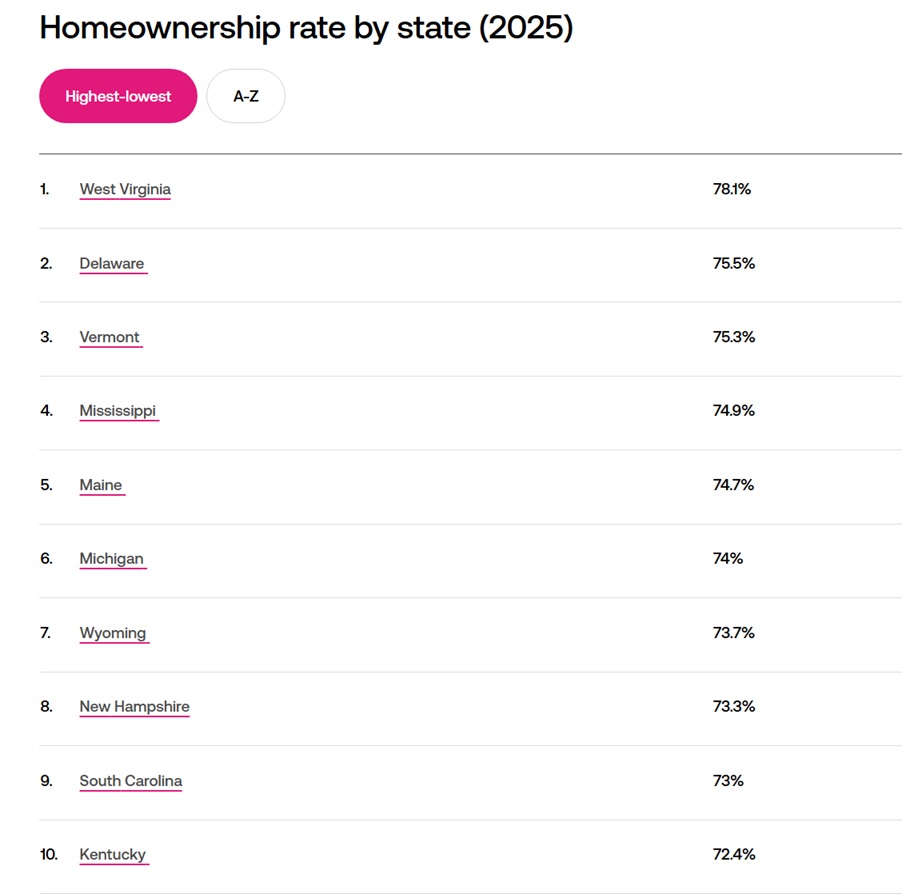
Top Ten States for Homeownership. Total Home Ownership by States can be found here: “What is the homeownership rate in the US?” USAFacts