Freddie Mac House Price Index Increased Slightly in August; Up 3.7% Year-over-year
Over the last 6 months, the seasonal adjusted index has increased at a 1.5% annual rate.
by Bill McBride
@ Calculated Risk
Note: The Freddie Mac index is a repeat sales index using only loans purchased by Fannie and Freddie and includes appraisals. See FAQs here. Freddie has data for all states and many cities. For house prices, I’m currently following Case-Shiller, FHFA, CoreLogic, ICE, the NAR median prices, and this Freddie Mac index.
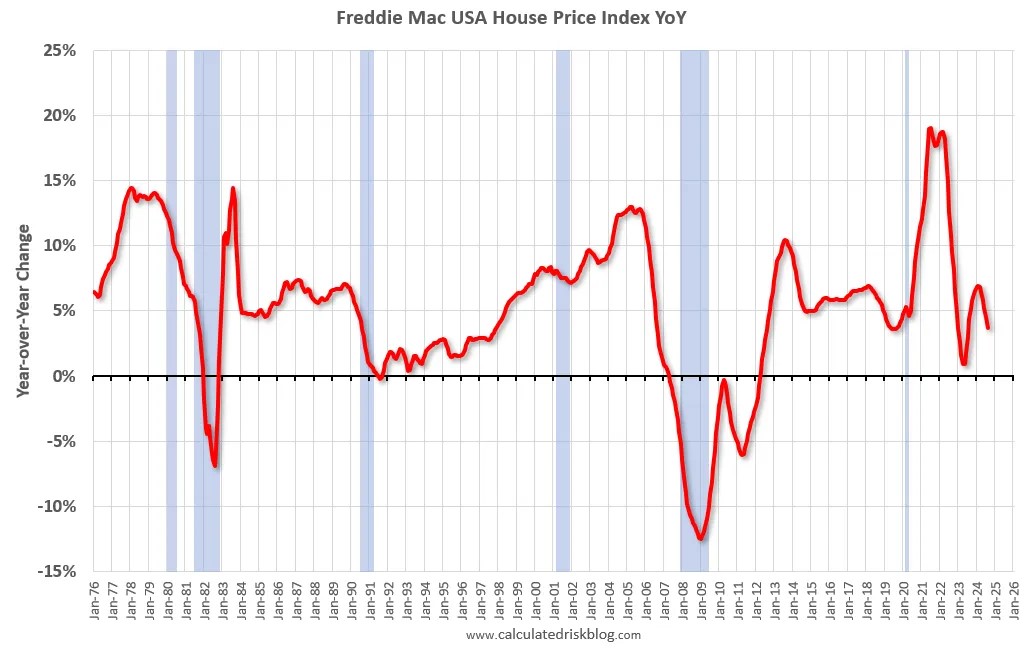
Freddie Mac reported that its “National” Home Price Index (FMHPI) increased 0.11% month-over-month on a seasonally adjusted (SA) basis in August. On a year-over-year basis, the National FMHPI was up 3.7% in August, down from up 4.5% YoY in July. The YoY increase peaked at 19.1% in July 2021, and for this cycle, bottomed at up 0.9% YoY in May 2023.
The second graph shows the month-over-month change in the national FMHPI, seasonally adjusted. The index has increased for 19 of the last 20 months after declining MoM for seven consecutive months.
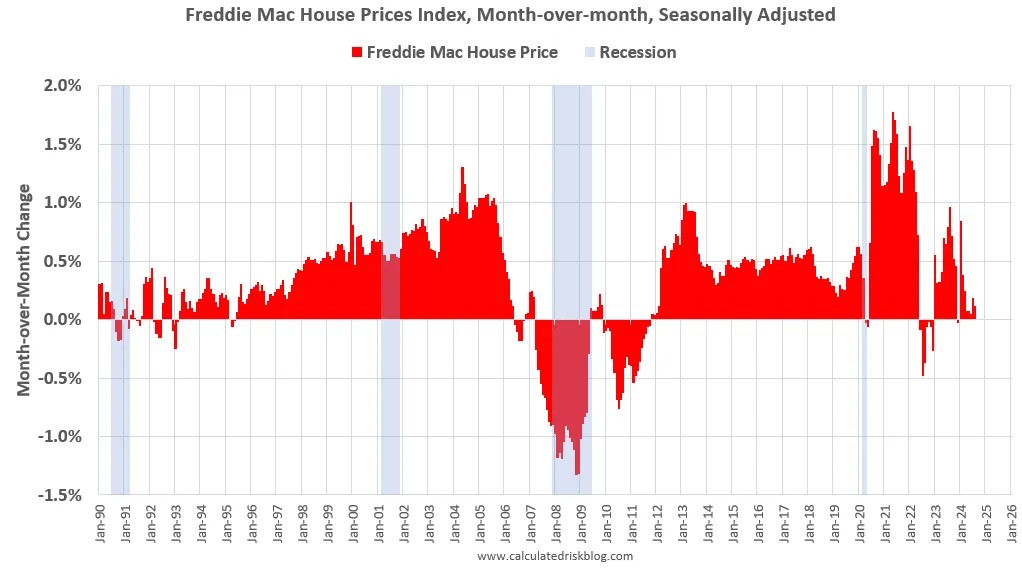
The FMHPI was up 0.11% MoM in August. Over the last 3 months, this index has increased at a 1.4% annual rate, and 1.5% annualized over the last 6 months (price growth slowing down).
15 States and D.C. have seen price declines Seasonally Adjusted
As of August, 15 states and D.C. were below their previous peaks, Seasonally Adjusted. The largest seasonally adjusted declines from the recent peak were in Louisiana (-2.5%), Arkansas (-2.1%), D.C. (-2.0), Florida (-1.9%), Texas (-1.5%), and Idaho (-1.1%).
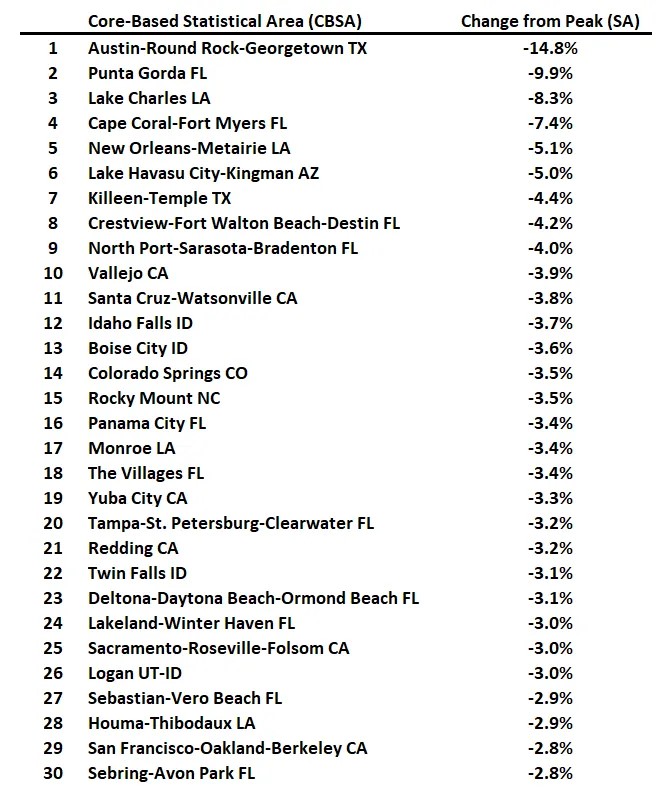
For cities (Core-based Statistical Areas, CBSA), here are the 30 cities with the largest declines from the peak, seasonally adjusted. Austin continues to be the worst performing city. However, 11 of the 30 worst performing cities are now in Florida!
Here is a comparison of year-over-year change in the FMHPI, median house prices from the NAR, and the Case-Shiller National index.
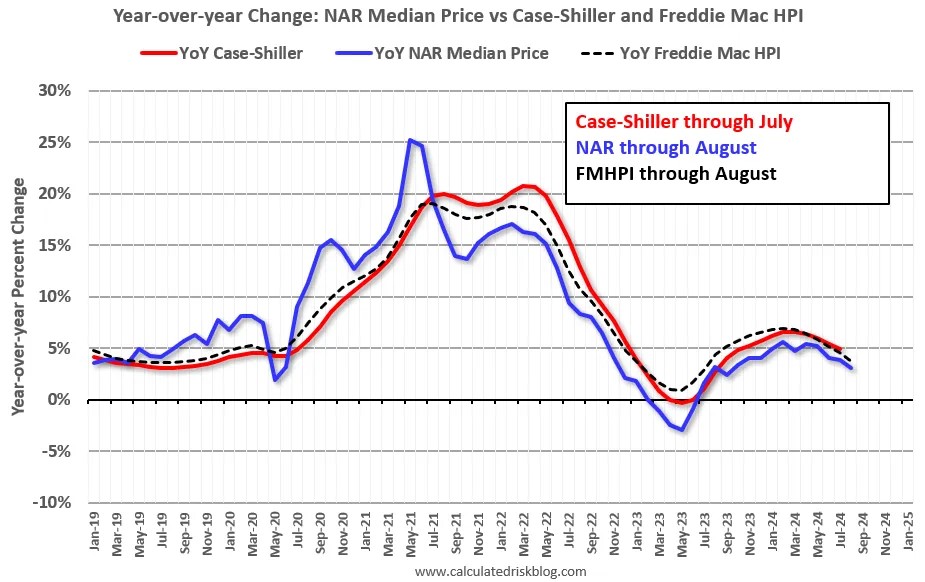
The FMHPI and the NAR median prices appear to be leading indicators for Case-Shiller. The Case-Shiller index was up 5.0% YoY in July. The FMHPI is suggesting a slower YoY increase in the Case-Shiller index.
With the slowdown in price increases over the last few months, and the increase in inventory, it appears house price growth (year-over-year) will continue to slow as the year progresses.