Abbreviated Report on Income in the US for 2023
I only provided a portion of the report and the 6 figures (one through six). The full report on Income can be found here: Income in the United States: 2023, Gloria Guzman and Melissa Kollar.
The economy was not as bad as the politicians and trump make it out to be, The numbers do not support their contention.
Some stats: As reported, median household income in 2023 was higher than in 2022. Income inequality was not significantly different between 2022 and 2023. Total number of workers increased by 2.2 million.
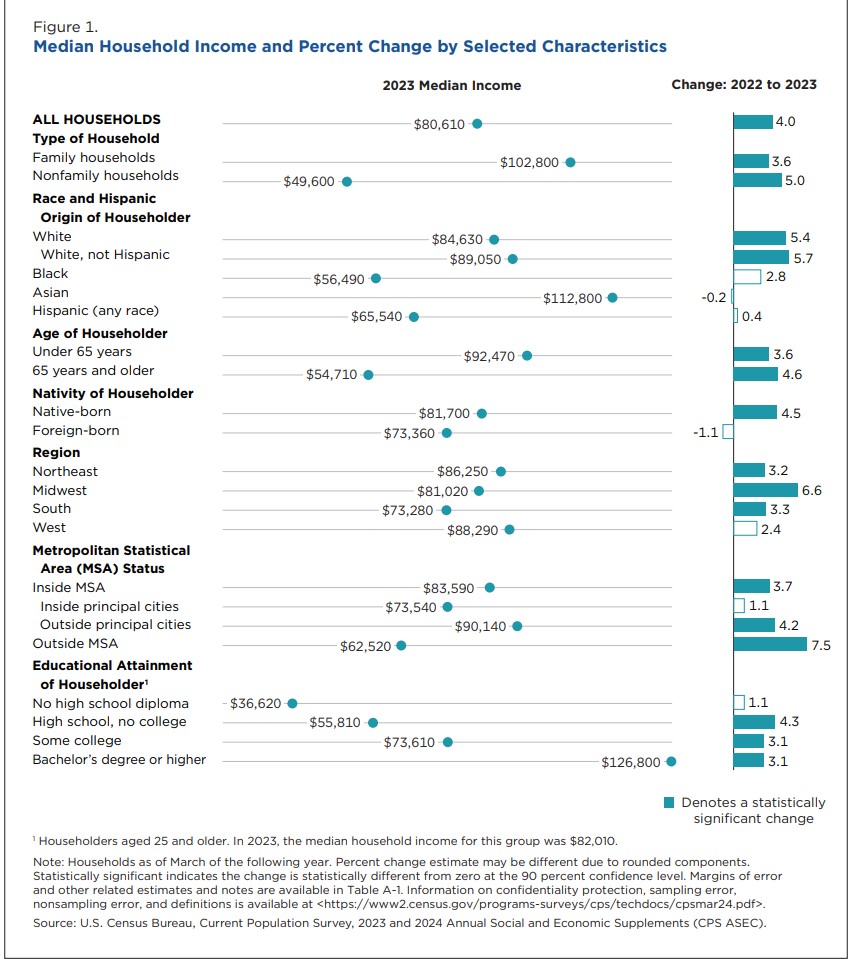
More numbers: The report provides estimates of household income, income inequality, and worker earnings in the United States for 2023. Median household income was $80,610, a 4.0 percent increase from the 2022 estimate.
For most demographic subgroups analyzed, median household income in 2023 was higher than in 2022. Income inequality as measured by the Gini index and percentile ratios was not significantly different between 2022 and 2023. The number of total workers increased by 2.2 million (1.3 percent) from 2022, while the change in the number of full-time, year-round workers was not statistically significant. The median earnings of all workers (including part-time and full-time basis) were not significantly different between 2022 and 2023, while median earnings of those who worked full-time, year-round decreased 1.6 percent.
The report also presents estimates on income, earnings, and inequality in the United States for calendar year 2023, based on information collected in the 2024 and earlier Current Population Survey Annual Social and Economic Supplements (CPS ASEC) conducted by the Census Bureau.
The income estimates in the main sections of this report are based on the concept of money income, which is pretax and does not account for the value of in-kind transfers. Appendix A (Page 13) provides a detailed explanation of how income is measured using the CPS ASEC. Estimates of post-tax income and inequality are included in Appendix B (Page 43).
This report begins with a section discussing median household income, highlighting year-to-year comparisons by characteristics such as race and Hispanic origin, nativity, region, and education. This is followed by sections on income inequality, workers, and median earnings. The income estimates in the main sections of this report are based on the concept of money income, which is pretax and does not account for the value of in-kind transfers. Estimates of post-tax income and inequality are included in
Appendix B.
~~~~~~~
Briefly
Real median household income was $80,610 in 2023, a 4.0 percent increase from the 2022 estimate of $77,540 (Figure 1 and Table A-1). This is the first statistically significant annual increase in real median household income since 2019.
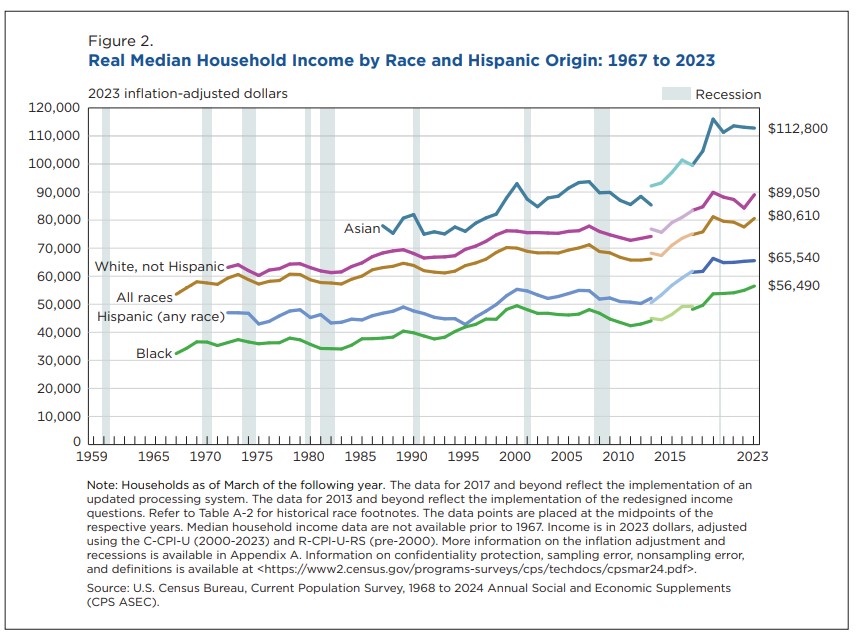
Real median household incomes increased by 5.4 percent for White households and by 5.7 percent for non-Hispanic White households between 2022 and 2023. There was no significant change in median
incomes for Black, Asian, and Hispanic households (Figure 2 and Table A-1)
Household income rose throughout the income distribution, increasing 6.7 percent at the 10th percentile and 4.6 percent at the 90th percentile (Table A-3).
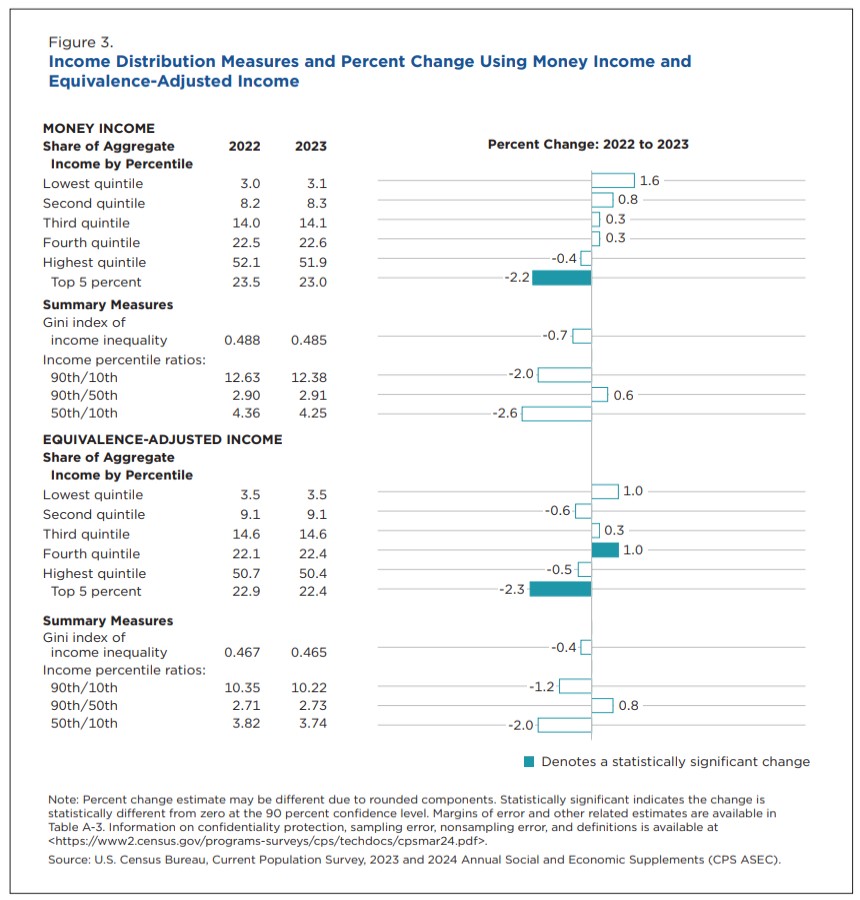
Income inequality as measured by the Gini index and income percentile ratios was not significantly different between 2022 and 2023 (Figure 3 and Table A-3).
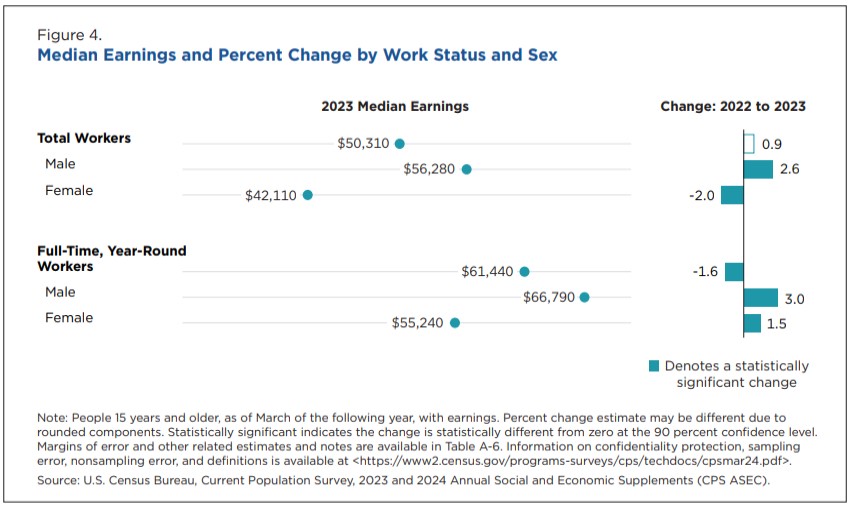
Real median earnings for men who worked full-time, year-round increased by 3.0 percent, and real median earnings increased 1.5 percent for women who worked full-time, year-round (Figure 4 and Table
A-6).
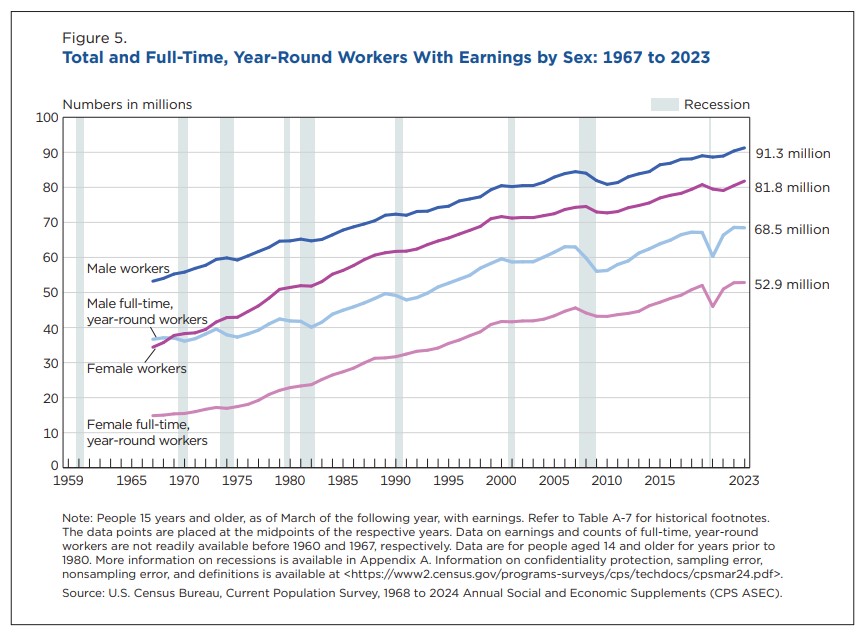
Between 2022 and 2023, the number of total workers increased by 2.2 million, or 1.3 percent. The change in the number of full-time, year-round workers was not statistically significant (Figure 5 and Table A-6).
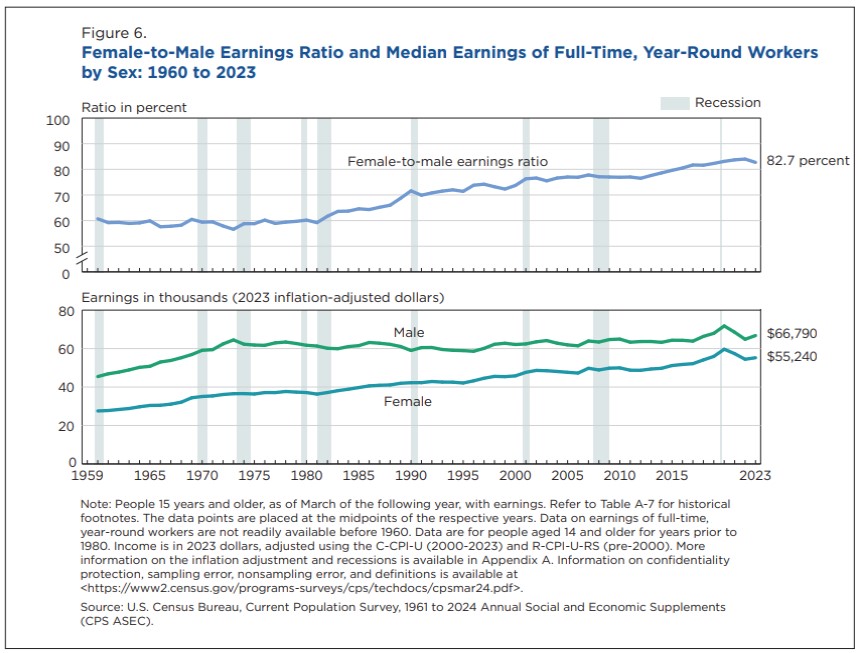
For full-time, year-round workers, the female-to-male earnings ratio in 2023 fell to 82.7 percent from 84.0 percent in 2022 (Figure 6 and Table A-6). This is the first statistically significant annual decrease in the female-to-male earnings ratio since 2003.

