Fastest wage growth over the last four years
Report on the impact from the expanded unemployment insurance, economic impact payments, aid to states and localities, child tax credits, and temporary protection from eviction amongst other measures as reported by the authors. These actions provided relief to workers and their families to help them weather the recession. These measures also fed the surge in employment, wages, and gave low-wage workers better job opportunities and leverage to see strong wage growth.
The graphs reveal the impact of the programs, The words detail the results So yes there is some reading involved besides the graphs. I minimized as much of it as possible without impeding the report’s integrity.
~~~~~~~
Fastest wage growth over the last four years among historically disadvantaged groups
by Elise Gould and Katherine deCourcy
Economic Policy Institute
Fastest wage growth over the last four years among historically disadvantaged groups: Low-wage workers’ wages surged after decades of slow growth, Economic Policy Institute.
Real wage growth at the 10th percentile was exceptionally strong, even in the face of high inflation
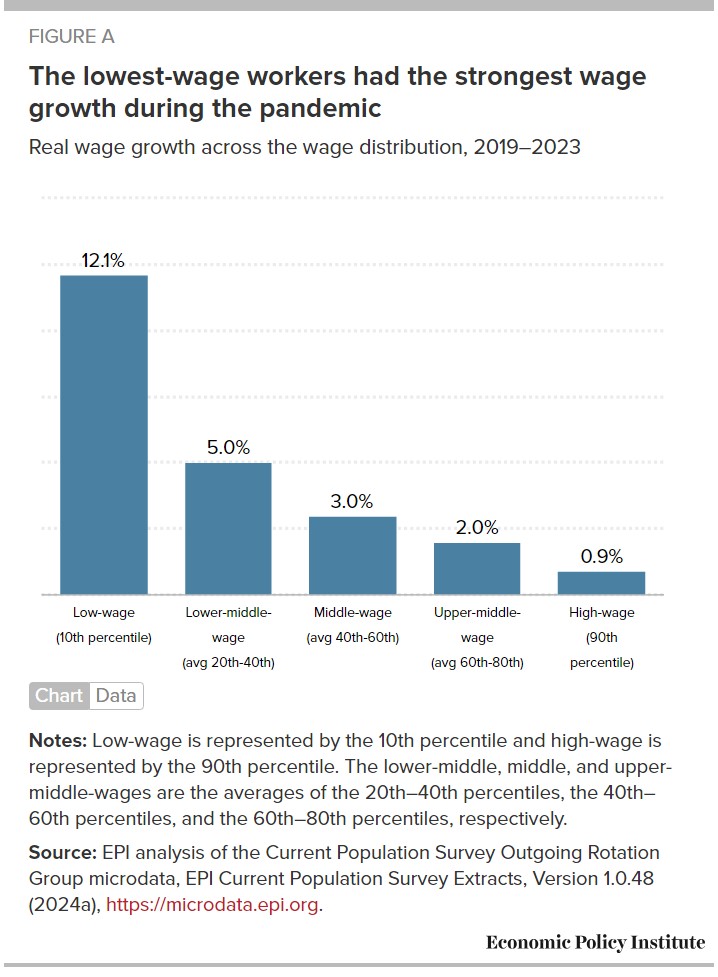
Wage growth strongest for low-wage workers between 2019 and 2023
In this analysis, we divide the wage distribution into roughly five groups to uncover recent wage trends at different wage levels. Figure A displays wage growth at the 10th percentile (“low-wage”), the average of the 20th–40th percentiles (“lower-middle-wage”), the average of the 40th–60th percentiles (“middle-wage”), the average of the 60th–80th percentiles (“upper-middle-wage”), and the 90th percentile (“high-wage”) using Current Population Survey (CPS) Outgoing Rotation Group microdata (EPI 2024a). Gould and deCourcy (2023) provide a more detailed discussion of these data measures and their robustness. Note that the 90th percentile as “high-wage” does not capture the earnings of those at the very top and is better captured with other data sets which are discussed briefly later on.
Our analysis focuses on changes in real wages between 2019 and 2023, as well as historical comparisons of real wage changes between 1979 and 2019. Our focus on 2019 and 2023 allows us to largely ignore the dramatic swings in employment and wages in 2020 and 2021, which were most impacted by the pandemic recession and initial recovery.1
Real wage growth at the 10th percentile was exceptionally strong—even in the face of high inflation
Between 2019 and 2023, hourly wage growth was strongest at the bottom of the wage distribution. The 10th-percentile real hourly wage grew 12.1% over the four-year period. To be clear, these are real (inflation-adjusted) wage changes. Overall inflation grew nearly 20%, or about 4.5% annually, between 2019 and 2023. Even with this historically fast inflation, particularly in the immediate aftermath of the pandemic recession, low-end wages grew substantially faster than price growth. Nominal wages (i.e., not inflation-adjusted) rose by roughly 34% cumulatively since 2019.
Across the wage distribution, we see the pace of wage growth declining for each successive wage group. Compared with the 12.1% wage growth at the bottom, growth was less than half as fast for lower-middle-wage workers (5.0%) and less than one-third as fast for middle-wage workers (3.0%) between 2019 and 2023. Upper-middle wages grew 2.0% over the four-year period, while the 90th-percentile wage grew even slower at 0.9%.
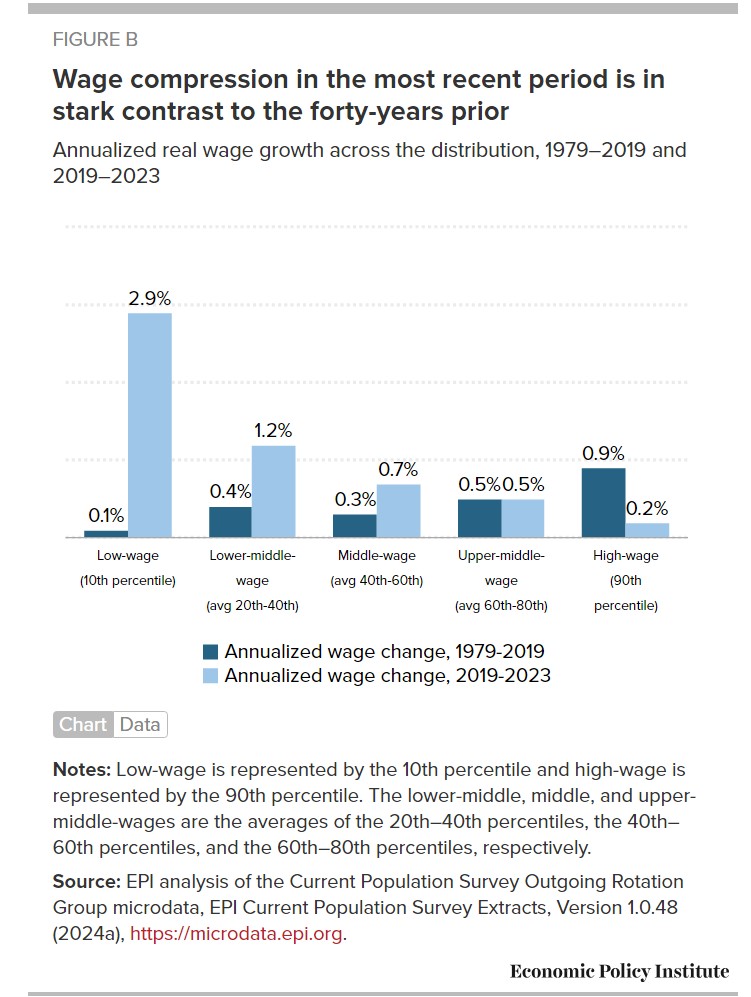
Wage compression in the most recent period contrasts sharply with prior 40 years
Because wages grew much faster at the 10th percentile than at the other four points, we measure within the 20th to 90th percentiles, wage compression has occurred. These findings—disproportionately strong wage growth at the bottom leading to wage compression—are consistent with the other research (see, for instance, Autor, Dube, and McGrew 2023).
This wage compression between 2019 and 2023 is in stark contrast with the experience of workers in the prior four decades. Figure B displays wage growth between 2019 and 2023 compared to wage growth between 1979 and 2019 for the same five wage groupings: low-wage, lower-middle-wage, middle-wage, upper-middle-wage, and high-wage. This time we report annualized wage changes in wages—which allow for comparison across periods which span different numbers of years, e.g. a four-year span versus a forty-year span.2
The differences in wage growth between these periods are striking. Whereas in the most recent period wage growth was stronger among each successive lower wage group, the opposite pattern occurs in the earlier forty-year period. Each successive higher wage group displays wage growth at least as fast as the previous one, except for between the lower-middle to the middle-wage group where there’s a small decrease.
In the most recent period, middle-wage workers experience growth more than three-times faster than high wage workers, but in the 1979-2019 period their wage growth was one-third as fast. The difference is even more extreme for the lowest wage workers: close to zero growth over the forty-year period versus nearly 3% annualized growth over the past four years. Except for the 90th percentile, all wage groups experienced wage growth at least as fast in the most recent period as between 1979 and 2019, and much faster among roughly the bottom half of the wage distribution.
The very top continues to amass larger shares of the overall pie
Changes at the very top of the wage distribution cannot be measured using the CPS, but Social Security Administration (SSA) data reveal what’s happening within the top 10%, 5%, 1%, and even 0.1% of the annual earnings distribution. Between 1979 and 2019, the bottom 90% grew 0.6% on an annualized basis, while the top 5% grew 2.0% and the top 0.1% grew 3.8% (Gould and Kandra 2023). There are vast differences not only between the top and the vast majority, but also within the top of the earnings distribution.
The latest SSA data only extends to 2022. The 2019–2022 period is characterized by relatively even growth. Primarily stock market declines in 2022 drove losses among the highest earners. After dropping significantly in 2022, the stock market rebounded greatly in 2023 (Trackinsight 2024). Therefore, very top earnings are likely to show a solid rebound in 2023, continuing the concentration of wages at the high end.
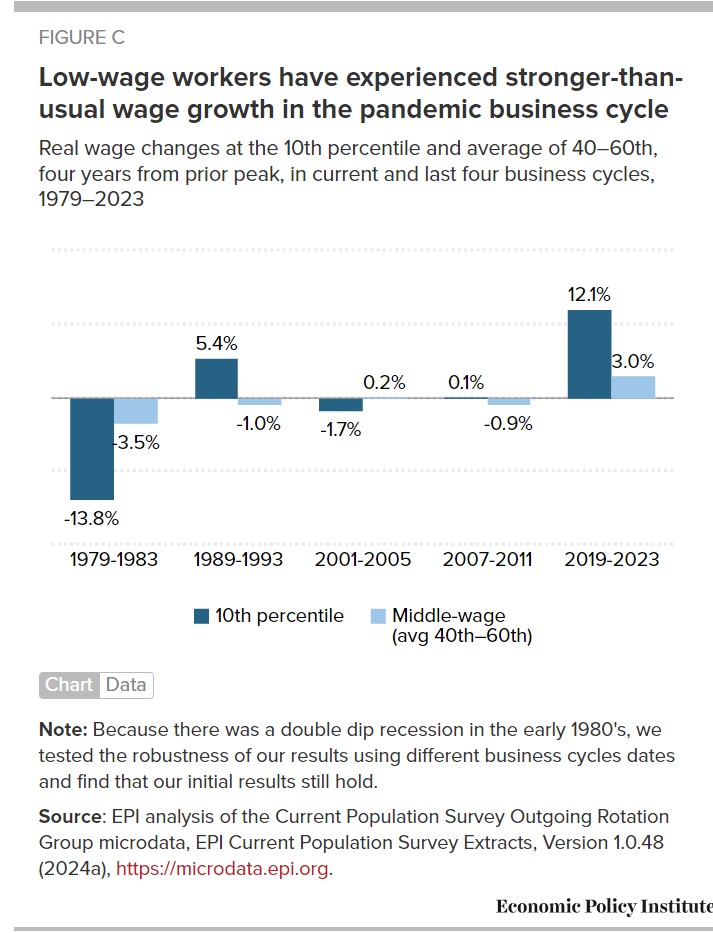
Figure C shows how exceptional this recovery has been in achieving strong wage growth for low-wage workers. The figure presents the real changes in the 10th-percentile wage and the middle wage four years from the prior peak in each business cycle since 1979. Wage growth at the 10th percentile in the current business cycle is more than twice as fast as the next closest period over the last 40 years.
Middle-wage workers, workers between the 40th and 60th percentiles of the wage distribution, experienced slower gains in the recent business cycle compared to low-wage workers. However, the slower middle-wage growth over the last four years was significantly faster than found in the four prior business cycles.
Faster growth for low-wage workers was driven by policy decisions and a tight labor market
The fast growth over the last four years (particularly for low-wage workers) didn’t happen by luck. It was largely the result of intentional policy decisions addressing the pandemic and subsequent recession at the scale of the problem. Policymakers learned from the aftermath of the Great Recession (2008). In which, the pursuit of austerity led to a slow and prolonged economic recovery.
Several large spending bills were passed in the first year of the pandemic. It provided enhanced and expanded unemployment insurance, economic impact payments, aid to states and localities, child tax credits, and temporary protection from eviction, among other measures (Gould and Shierholz 2022). These actions provided relief to workers and their families to help them weather the recession. These measures also fed the surge in employment, which gave low-wage workers better job opportunities and leverage to see strong wage growth.
Unemployment fell to 3.6% in 2022 and held steady in 2023 as both the labor force and employment grew. The share of the population ages 25-54 with a job (the prime-working-age employment to population ratio (EPOP)) rose to 80.7% in 2023. It surpassed even the pre-pandemic high of 80.0% in 2019. In fact, we have to go back to 2000 to find a prime-working-age EPOP exceeding the level reached in 2023.
This tightening labor market further bolstered workers’ leverage. Low unemployment means workers are relatively scarce. The result requires employers to work harder to attract and retain workers and lessens their discretion to discriminate without facing a profitability penalty. In low-unemployment labor markets, lower-wage and historically marginalized workers experience better labor market outcomes and faster wage growth (Bivens and Zipperer 2018; Wilson and Darity 2022).
Additionally, the sudden loss of millions of low-wage jobs at the start of the pandemic, followed by the extraordinarily fast employment recovery, meant the frictions tying workers to particular jobs or the barriers normally keeping workers from searching for better employment opportunities were not constraining workers looking for work in this period. This “severed monopsony” in a time of furious re-hiring reduced the normal drag on wage growth imposed by these frictions (Bivens 2023). High numbers of low-wage workers quit and found better jobs, increasing churn in the low-wage labor market. This phenomenon increased low-wage workers’ leverage, which further contributed to faster wage growth. Employers simply had to work harder to attract and retain the workers they wanted.
I am going to stop here as the rest of this report goes beyond what was done during the Pandemic. Not that what is being said is bad. It is the next level of wage improvements (such as improved minimum wage laws, etc,). My concentration was on the pandemic.
~~~~~~~~
1. In 2020, the bottom dropped out of the labor market as low-wage and low-hours workers lost their jobs in disproportionate numbers (Gould and Kandra 2021; Gould and Kassa 2021). As the recovery took hold in 2021, swings in the composition of the workforce by gender, race/ethnicity, education, work hours, industry, and occupation made it necessary to account for these differences in measuring wage changes in the pandemic labor market (Gould and Kandra 2022). By 2022, the dramatic compositional shifts in the pandemic labor market had mostly resolved (Gould and DeCourcy 2023). In the latest year of data, most measurable spikes in the workforce by demographic and job characteristics normalized in the last year. As a percent of the workforce, white workers, workers with lower levers of educational attainment, and leisure and hospitality workers are found at slightly lower rates in 2023 than in 2019.
2. Appendix Figure A provides a look at cumulative real wage changes over the entire period, 1979 to 2023, to get a sense of overall wage trends. Even though the most recent period exhibited wage compression, it’s clear that the much longer forty-year period of unequal growth remains the most striking finding from the overall period.
As mentioned in the Atlantic by Rogé Karma, in support of his article “The U.S. Economy Reaches Superstar Status.”