Climate Change Indicators: U.S. Green House Gas Emissions
Updates on Green House Gas and Climate Change. Rather than have readers flip from chart to chart on different pages, I consolidated the Green House Gas charts on one page. When it says see Figure 2 or 3, the chart is nearby and clearly marked. The update as marked on the original piece is Web update: November 2023. So, this is fairly current. It appears the US is making some headway in decreasing emissions. It also is said, the US has a long way to go.
More information on the link US EPA (just below).
US EPA 1990 – 2021
Climate Change Indicators detailing emissions of greenhouse gases by Gas, by Economic Sector, and per Capita and Per Dollar in the United States.
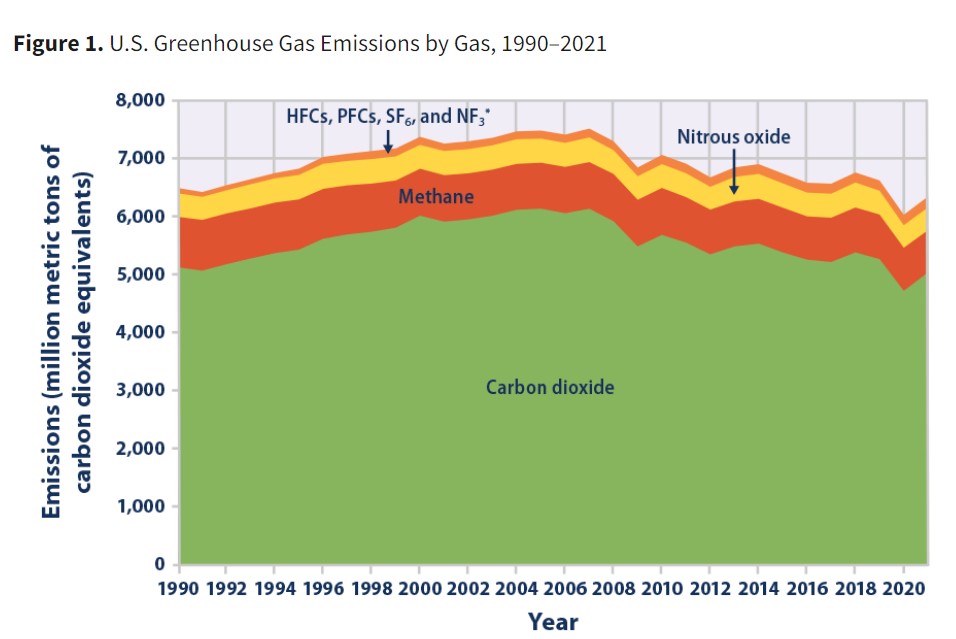
This figure shows emissions of carbon dioxide, methane, nitrous oxide, and several fluorinated gases in the United States from 1990 to 2021. For consistency, emissions are expressed in million metric tons of carbon dioxide equivalents.
* HFCs are hydrofluorocarbons, PFCs are perfluorocarbons, SF6 is sulfur hexafluoride, and NF3 is nitrogen trifluoride.
Data source: U.S. EPA, 20234
Key Points
Emissions of carbon dioxide, methane, nitrous oxide, and several fluorinated gases in the United States from 1990 to 2021. For consistency, emissions are expressed in million metric tons of carbon dioxide equivalents.
- In 2021, U.S. greenhouse gas emissions totaled 6,340 million metric tons (14.0 trillion pounds) of carbon dioxide equivalents. This total represents a 2.3 percent decrease since 1990, down from a high of 15.8 percent above 1990 levels in 2007. The sharp decline in emissions from 2019 to 2020 was largely due to the impacts of the coronavirus (COVID-19) pandemic on travel and economic activity. Emissions increased from 2020 to 2021 by 5.2 percent, driven largely by an increase in carbon dioxide emissions from fossil fuel combustion due to economic activity rebounding after the height of the COVID-19 pandemic (see Figure 1).
- For the United States, during the period from 1990 to 2021 (see Figure 1):
- Emissions of carbon dioxide, the primary greenhouse gas emitted by human activities, decreased by 2 percent.
- Methane emissions decreased by 16 percent, as reduced emissions from landfills, coal mines, and natural gas systems more than offset increases in emissions from activities such as livestock production.2
- Nitrous oxide emissions, predominantly from agricultural soil management practices such as the use of nitrogen as a fertilizer, decreased by 3 percent.
- Emissions of fluorinated gases (hydrofluorocarbons, perfluorocarbons, sulfur hexafluoride, and nitrogen trifluoride), released as a result of commercial, industrial, and household uses, increased by 105 percent.
- Among the various sectors of the U.S. economy, transportation accounts for the largest share—28.5 percent—of 2021 emissions. Transportation has been the largest contributing sector since 2017. Electric power (power plants) accounts for the next largest share of 2021 emissions, accounting for approximately 25 percent of emissions. Electric power has historically been the largest sector, accounting for 30 percent of emissions since 1990 (see Figure 2).
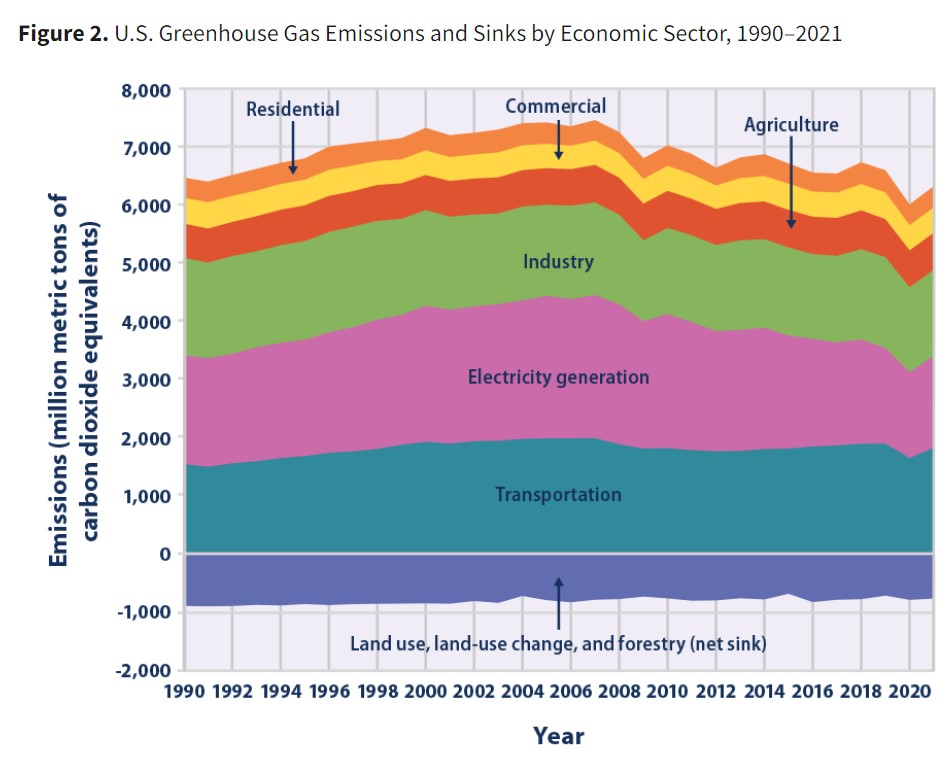
This figure shows greenhouse gas emissions and sinks (negative values) by source in the United States from 1990 to 2021. For consistency, emissions are expressed in million metric tons of carbon dioxide equivalents. All electric power emissions are grouped together in the “Electric power” sector, so other sectors such as “Residential” and “Commercial” are only showing non-electric sources, such as burning oil or gas for heating. Totals do not match Figure 1 exactly because the economic sectors shown here do not include emissions from U.S. territories outside the 50 states.
Data source: U.S. EPA, 20235
- Removals from sinks, the opposite of emissions from sources, absorb or sequester carbon dioxide from the atmosphere. In 2021, 12 percent of U.S. greenhouse gas emissions were offset by net sinks resulting from land use and forestry practices (see Figure 2). One major sink is the net growth of forests, including urban trees, which remove carbon from the atmosphere. Other carbon sinks are associated with how people manage and use the land, including the practice of depositing yard trimmings and food scraps in landfills. While the land use, land-use change, and forestry category represents an overall net sink of carbon dioxide in the United States, this category also includes emission sources resulting from activities such as wildfires, converting land to cropland, and emissions from flooded lands such as reservoirs.
- Emissions increased at about the same rate as the population from 1990 to 2007, which caused emissions per capita to remain fairly level (see Figure 3). Total emissions and emissions per capita declined from 2007 to 2009, due in part to a drop in U.S. economic production during this time. Emissions decreased again from 2010 to 2012 and continued downward largely due to the growing use of natural gas and renewables to generate electricity in place of more carbon-intensive fuels.3
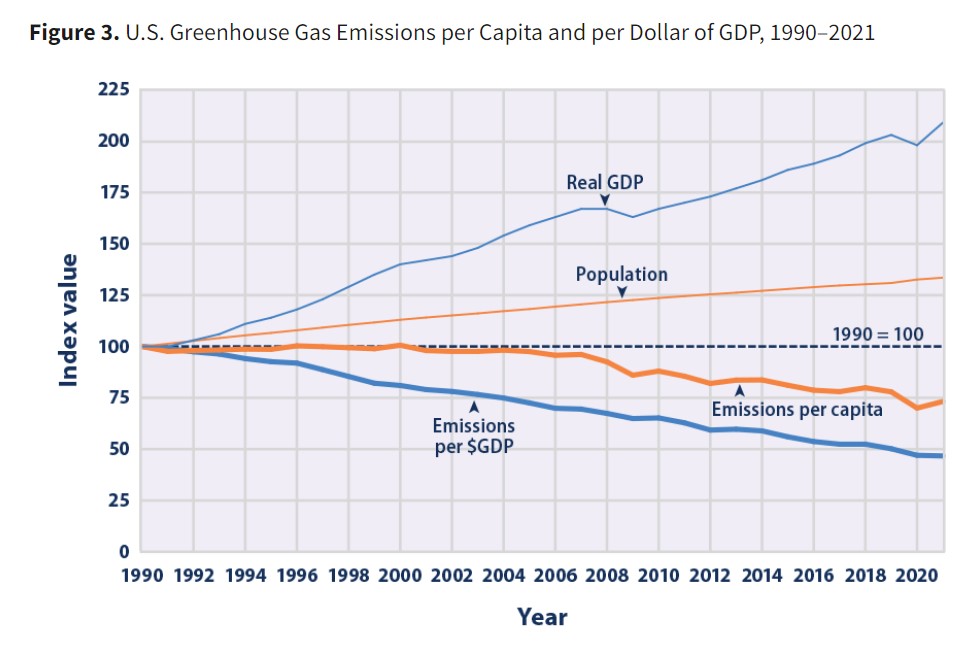
This figure shows trends in greenhouse gas emissions from 1990 to 2021 per capita (heavy orange line), based on the total U.S. population (thin orange line). It also shows trends in emissions per dollar of real GDP (heavy blue line). Real GDP (thin blue line) is the value of all goods and services produced in the country during a given year, adjusted for inflation. All data are indexed to 1990 as the base year, which is assigned a value of 100. For instance, a real GDP value of 209 in the year 2021 would represent a 109 percent increase since 1990.
Data source: U.S. EPA, 20236
- From 1990 to 2021, greenhouse gas emissions per dollar of goods and services produced by the U.S. economy (the gross domestic product or GDP) declined by 53 percent (see Figure 3). This change may reflect a combination of increased energy efficiency and structural changes in the economy.
Background and Information
Factors influencing the quantities of greenhouse gases released into the atmosphere, include economic activity, population, consumption patterns, energy prices, land use, and technology. There are several ways to track these emissions, such as by measuring emissions directly, calculating emissions based on the amount of fuel that people burn, and estimating other activities and their associated emissions. EPA has two key programs that provide data on greenhouse gas emissions in the United States: the Inventory of U.S. Greenhouse Gas Emissions and Sinks and the Greenhouse Gas Reporting Program. See “Sources of Data on U.S. Greenhouse Gas Emissions.”
References
1. U.S. EPA (U.S. Environmental Protection Agency). 2023. Inventory of U.S. greenhouse gas emissions and sinks: 1990–2021. EPA 430-R-23-002. www.epa.gov/ghgemissions/inventory-us-greenhouse-gas-emissions-and-sinks.
2. U.S. EPA (U.S. Environmental Protection Agency). 2023. Inventory of U.S. greenhouse gas emissions and sinks: 1990–2021. EPA 430-R-23-002. www.epa.gov/ghgemissions/inventory-us-greenhouse-gas-emissions-and-sinks.
3. U.S. EPA (U.S. Environmental Protection Agency). 2023. Inventory of U.S. greenhouse gas emissions and sinks: 1990–2021. EPA 430-R-23-002. www.epa.gov/ghgemissions/inventory-us-greenhouse-gas-emissions-and-sinks.
4. U.S. EPA (U.S. Environmental Protection Agency). 2023. Inventory of U.S. greenhouse gas emissions and sinks: 1990–2021. EPA 430-R-23-002. www.epa.gov/ghgemissions/inventory-us-greenhouse-gas-emissions-and-sinks.
5. U.S. EPA (U.S. Environmental Protection Agency). 2023. Inventory of U.S. greenhouse gas emissions and sinks: 1990–2021. EPA 430-R-23-002. www.epa.gov/ghgemissions/inventory-us-greenhouse-gas-emissions-and-sinks.
6. U.S. EPA (U.S. Environmental Protection Agency). 2023. Inventory of U.S. greenhouse gas emissions and sinks: 1990–2021. EPA 430-R-23-002. www.epa.gov/ghgemissions/inventory-us-greenhouse-gas-emissions-and-sinks.
Climate Change Indicators: U.S. Greenhouse Gas Emissions | US EPA
Meanwhile in China, they burn more coal than the rest of the entire world combined. What we are emitting is a drop in the bucket compared to them and their emissions continue to grow rapidly.
@Mark,
While China does burn slightly over half of the world’s coal, that is still less per capita than Germany, South Africa, Poland, Australia, The Czech Republic and Serbia.
https://www.worldometers.info/coal/coal-consumption-by-country/
What a coincidence, I heard that on teevee too!
Dobbins
I am a little fed up with people who are always looking for someone else to blame. It makes them stupid. Let us take care of our drop in the bucket and see what happens. Or fill up your gas tank, stop at MacDonald’s for a rain forest hamburger, and see how fast you can drive off the nearest cliff.
@Mark,
Meanwhile, a quarter of all EVs sold in Europe are made in China. Meanwhile, China is building huge expanses of rail in China and Laos. Meanwhile, China added 215 GW of solar PV capacity alone in 2023 that was equal to 14% of the world’s total installed solar PV capacity, more than what many countries have ever installed in total. Meanwhile, China has decommissioned over 70 GW of coal-fired plants in the last decade and is building far more renewable energy.
Angry Bear [Bill?]
thank you for posting this. it’s nice to have some real facts to think about.
but “progress”? after 30 years I can’t see a significant difference. but from the last chart it is evident that the problem is growth in the population. Russia may have an ap for that. Meanwhile everyone else is screaming to increase the population so there will be enough kids to pay for Social Security, which is both stupid, and stupid. well, and also stupid.