Eleven* Years of #ACA Medicaid Expansion in One Image
Eleven* Years of #ACA Medicaid Expansion in One Image, ACA Signups, Charles Gaba

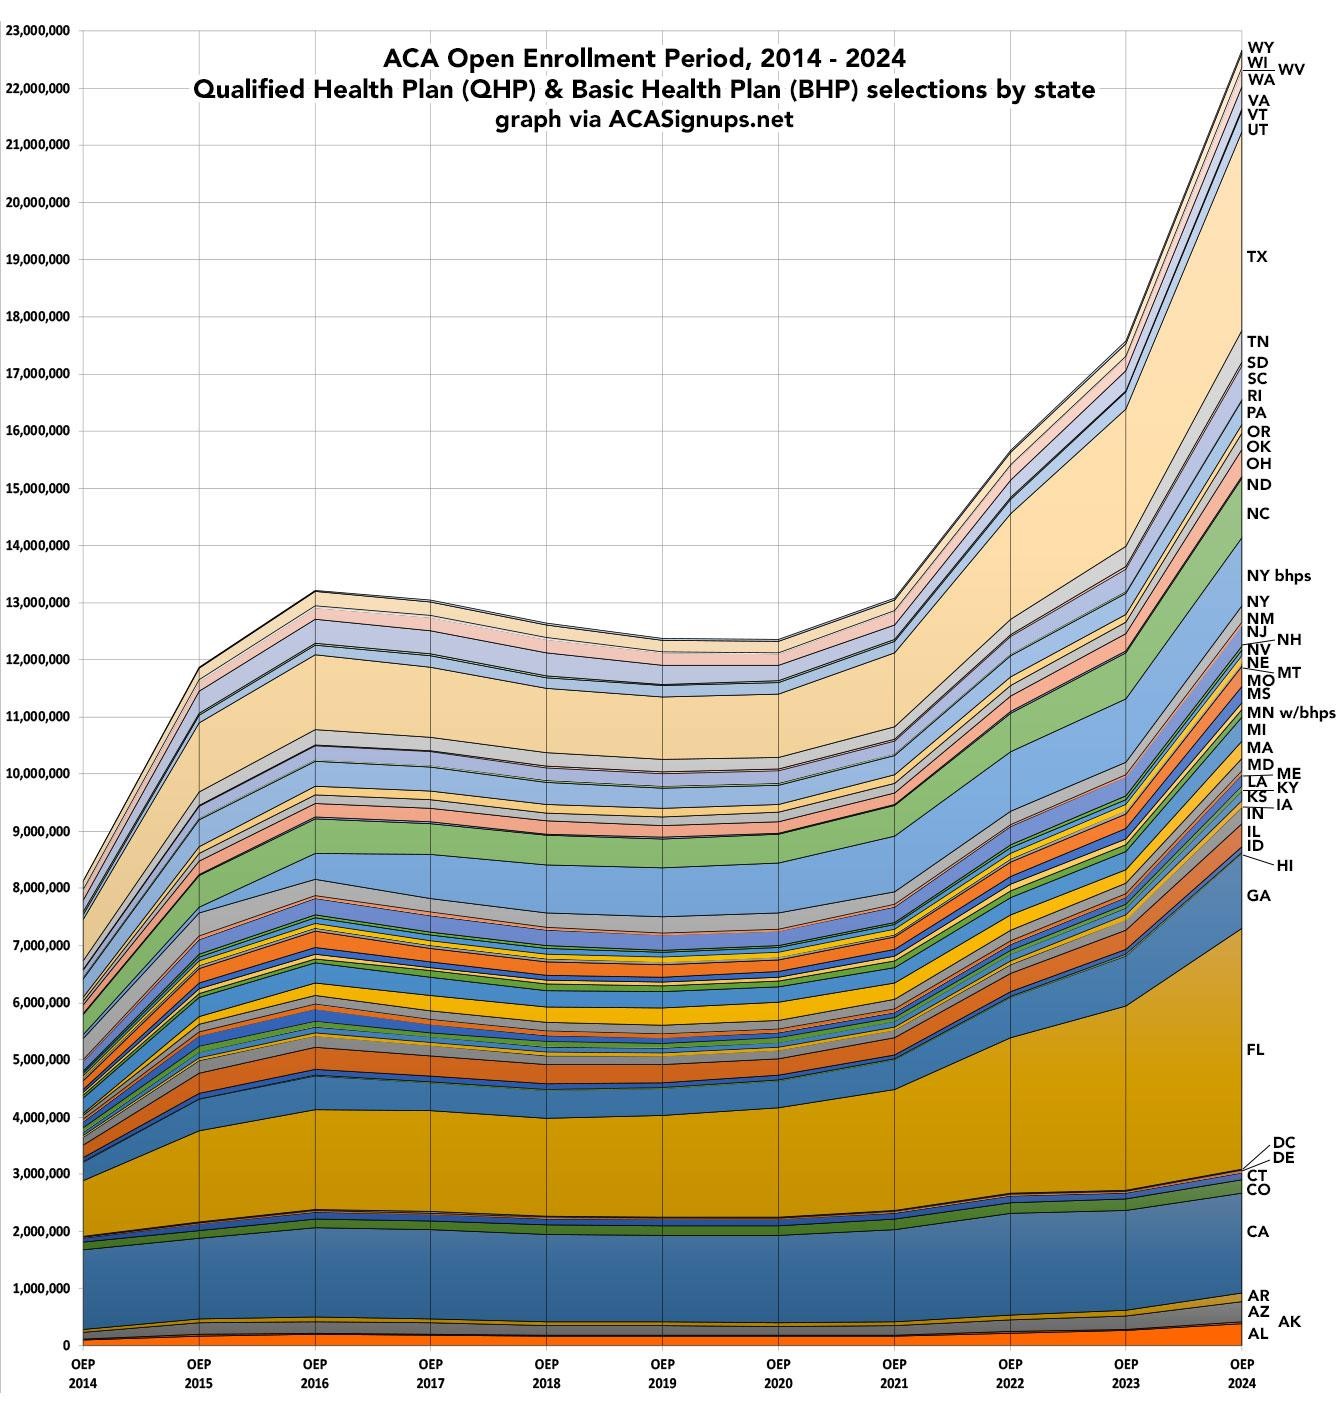
I just posted a colorful graph which tracked ACA Qualified Health Plan (QHP) enrollment over eleven years of Open Enrollment Periods.
Below I’ve done the same thing for ACA Medicaid Expansion. The data comes from the Centers for Medicare & Medicaid Services quarterly Medicaid Budget & Expenditure System reports.
*Unfortunately, the MBES reports only run through June 2023, so it’s missing 6 months of updates (which have likely shown a small drop in ACA Expansion Medicaid enrollees due to the ongoing Unwinding process). It therefore actually only includes 10 1/2 yrs of enrollment data.
Also keep in mind that if the remaining 10 states had expanded Medicaid under the ACA by now, the grand total would have been several million higher.
No further analysis or comment here; I just think this is a pretty cool graphic . . . and keep in mind that most of the ~24.5 million people represented here would have been utterly screwed from early 2020 – early 2023 without the Affordable Care Act being in place when the pandemic hit. Click the image for a higher-resolution version; the states are listed on the right-hand side, though they might be difficult to make out (also note that Guam, Puerto Rico and the U.S. Virgin Islands also have a number of ACA expansion enrollees shown):
Bill:
Guess who else benefited.