Healthcare Utilization, Costs, and Pricing Drivers – 2017 and 2021
Health Care Cost and Utilization Report, healthcostinstitute.org, April 2023
Year-over-year and 5-year cumulative trends in health care spending for individuals with employer-sponsored insurance. A detailed report by the Health Care Cost Institute covering the period 2017 – 2021 which includes the Covid pandemic. Decreases i total costs were seen during the pandemic. Still in the end, you will see pricing being the biggest factor in healthcare costs. Pricing nines times greater than the costs due to inflation over the five years of reporting.
I spent time editing this report to make it easier to understand. Not that it was bad reporting. I just made it simpler using the knowledge I had on costing. The content still belongs the Health Care and Cost Institute. I just made it a better read. Click on images to enlarge if needed.
Changed the title to make it interesting rather than titling it a cost and utilization report. Skipped some sections and concentrated of drivers and cost. I can not offer prizes or gifts at the end of this post if you complete the read. I hope you gain greater knowledge.
Introduction
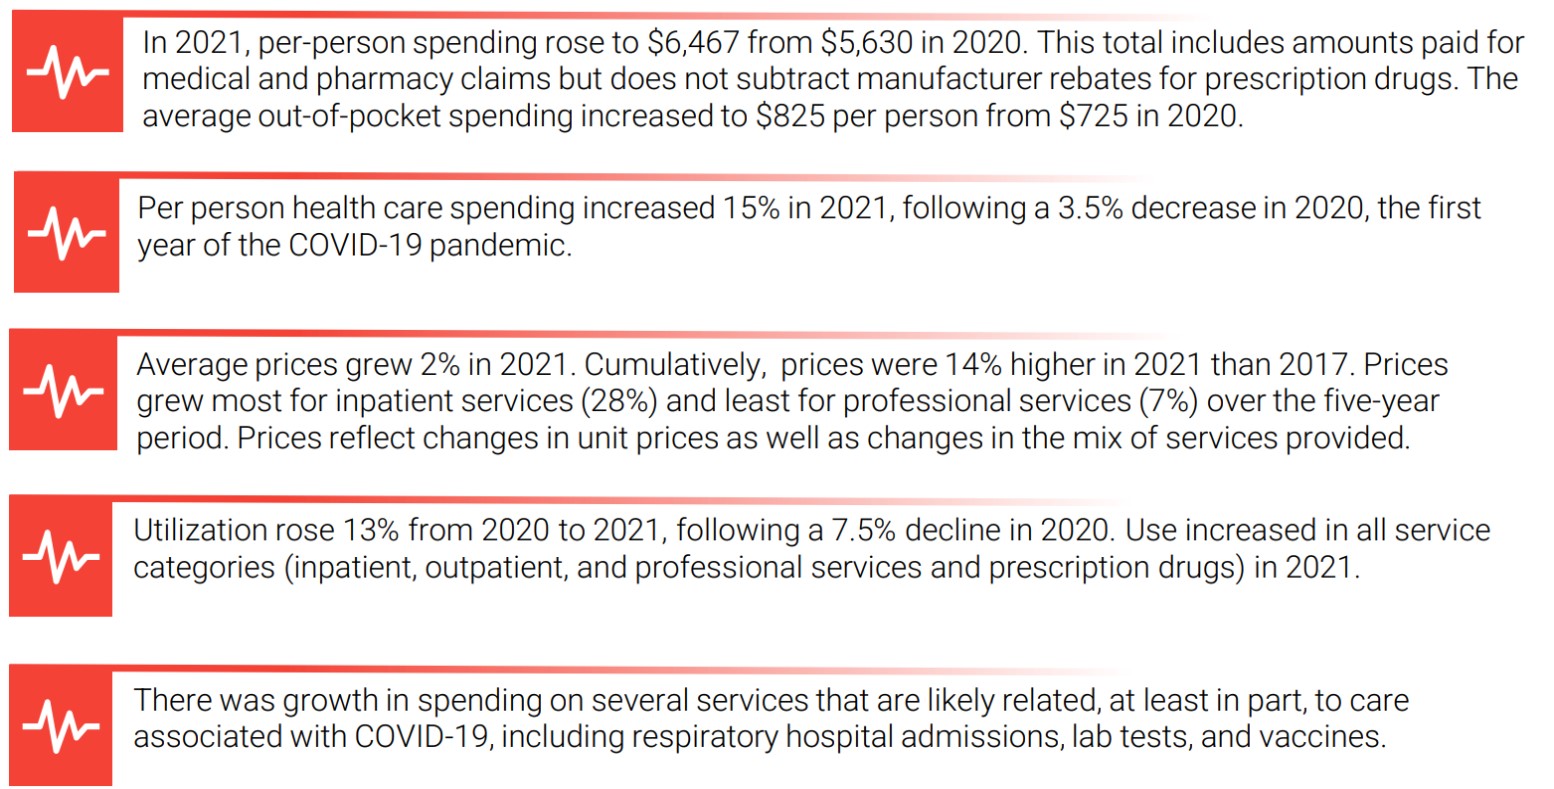
Average annual health care spending for people with employer-sponsored insurance spending increased to $6,467 in 2020 from $5,630 in 2019*. Per person health care spending increased 15% in 2021, following a 4% decrease in 2020, the first year of the COVID-19 pandemic. (Initial report said 2020 to 2020 which made no sense. I changed it to 2019).
As pulled from the executive summary. A general review . . .
In 2020, lower use of health care services led to the first decline in per person health care spending seen in 12 years. The decline in utilization was concentrated in the early months of the pandemic. By mid-2020, Heath Care Cost Institute (HCI) data shows use (and spending) largely returned to pre-pandemic levels.
In 2021, a full rebound in per person health care spending of nearly $6,500 (15% higher than in 2020). A 13% increase in utilization from 2020 to 2021 contributed to this growth. This increase following the 7.5% decline in use in 2020. Average prices grew 2% from 2020 to 2021. A lower growth rate than in previous years reflects the overall mix of care was less expensive in 2021 than in 2020 when many lower cost preventive services were delayed.
Overall, prices grew close to 14% over the 2017-2021 period while use grew just over 7%. The largest growth in prices being in inpatient hospital services, growing at 28% even as use declined over the five – year period. Growth in health care prices, and particularly in hospital prices, remains a persistent challenge to access and affordability.
Spending per Person 2017 – 2021
Figure 1 depicts spending percentage per person 2017 – 2021. Spending increasing $1,133, from $5,334 to $6,467 (21.2%). Increased spending driven by rising average prices. Prices grew ~14% over 2017–21. There was a cumulative 7.1% increase in utilization.
Figure 2 depicts annual changes (decrease or increase) in spending per person. Utilization was relatively flat 2017-2019, decreased 7.5% 2019 – 2020 (pandemic), and increased 12.8% 2020-2021. Cumulatively increasing Utilization of 7.1% from 2017-2021. Reflecting an average annual growth of close to 4% over 2017–2020, prices grew 2% in 2021 due to less costly preventive services. The mix of treatment changed from surgical to preventative services.

Health Care Spending: Variation by Service Category
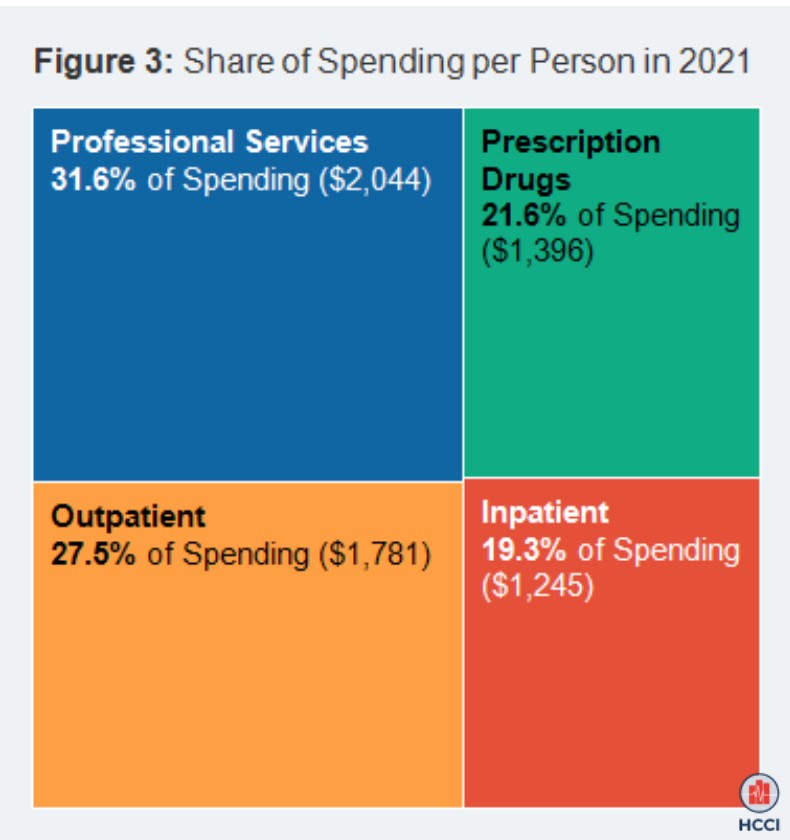
Per-person spending grew to $5,834 in 2019, decreased to $5,630 in 2020, and rose to $6,467 in 2021. As shown in Figure 3, the largest category of spending was professional services ($2,044). This includes professional (physician) services provided in offices as well as in facilities (during a hospital admission).
The second largest category of spending was facility payments for out-patient visits and procedures ($1,781), followed by prescription drugs ($1,396), and facility payments for inpatient admissions ($1,245). The spending on prescription drugs reflects negotiated discounts from wholesale or list prices. However, the pricing does not account for manufacturer rebates provided through separate transactions. Prescription drug prices in this report are point-of-sale.
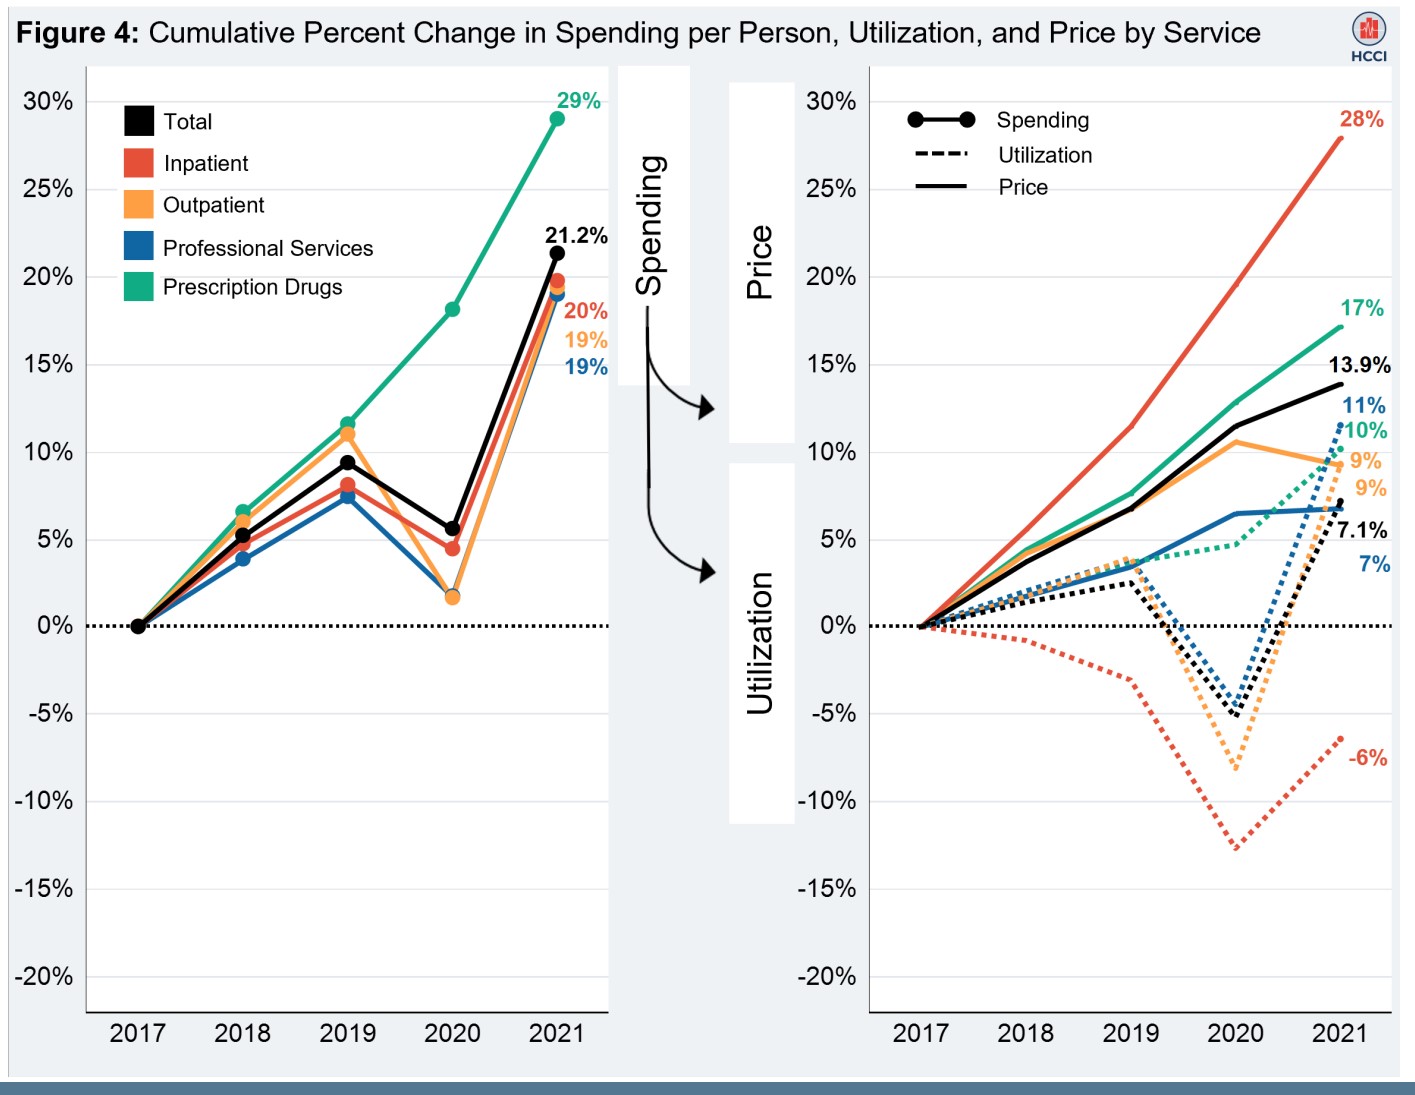
Spending increases were driven by rising prices for services within each category. Between 2017 and 2021, utilization increased 7.1%. Over the same period, prices increased 13.9% [Figure 4]. Across the service categories, the contribution of average prices and utilization to the change in spending varied. Inpatient services experienced the largest cumulative decline in use (-6.4%) while prices grew 27.9%. Outpatient and professional services and prescription drugs had cumulative increases in use of 9-11%, driven by rising use in 2021.
In all categories, prices grew between 2017 and 2021. Inpatient prices had the greatest cumulative increase (27.9%) while the smallest increase in prices was for professional services (6.8%). Rising prices drove cumulative increases in spending across all service categories, with the largest growth in prescription drug spending (29.0%).
Changes in Spending by Service Category
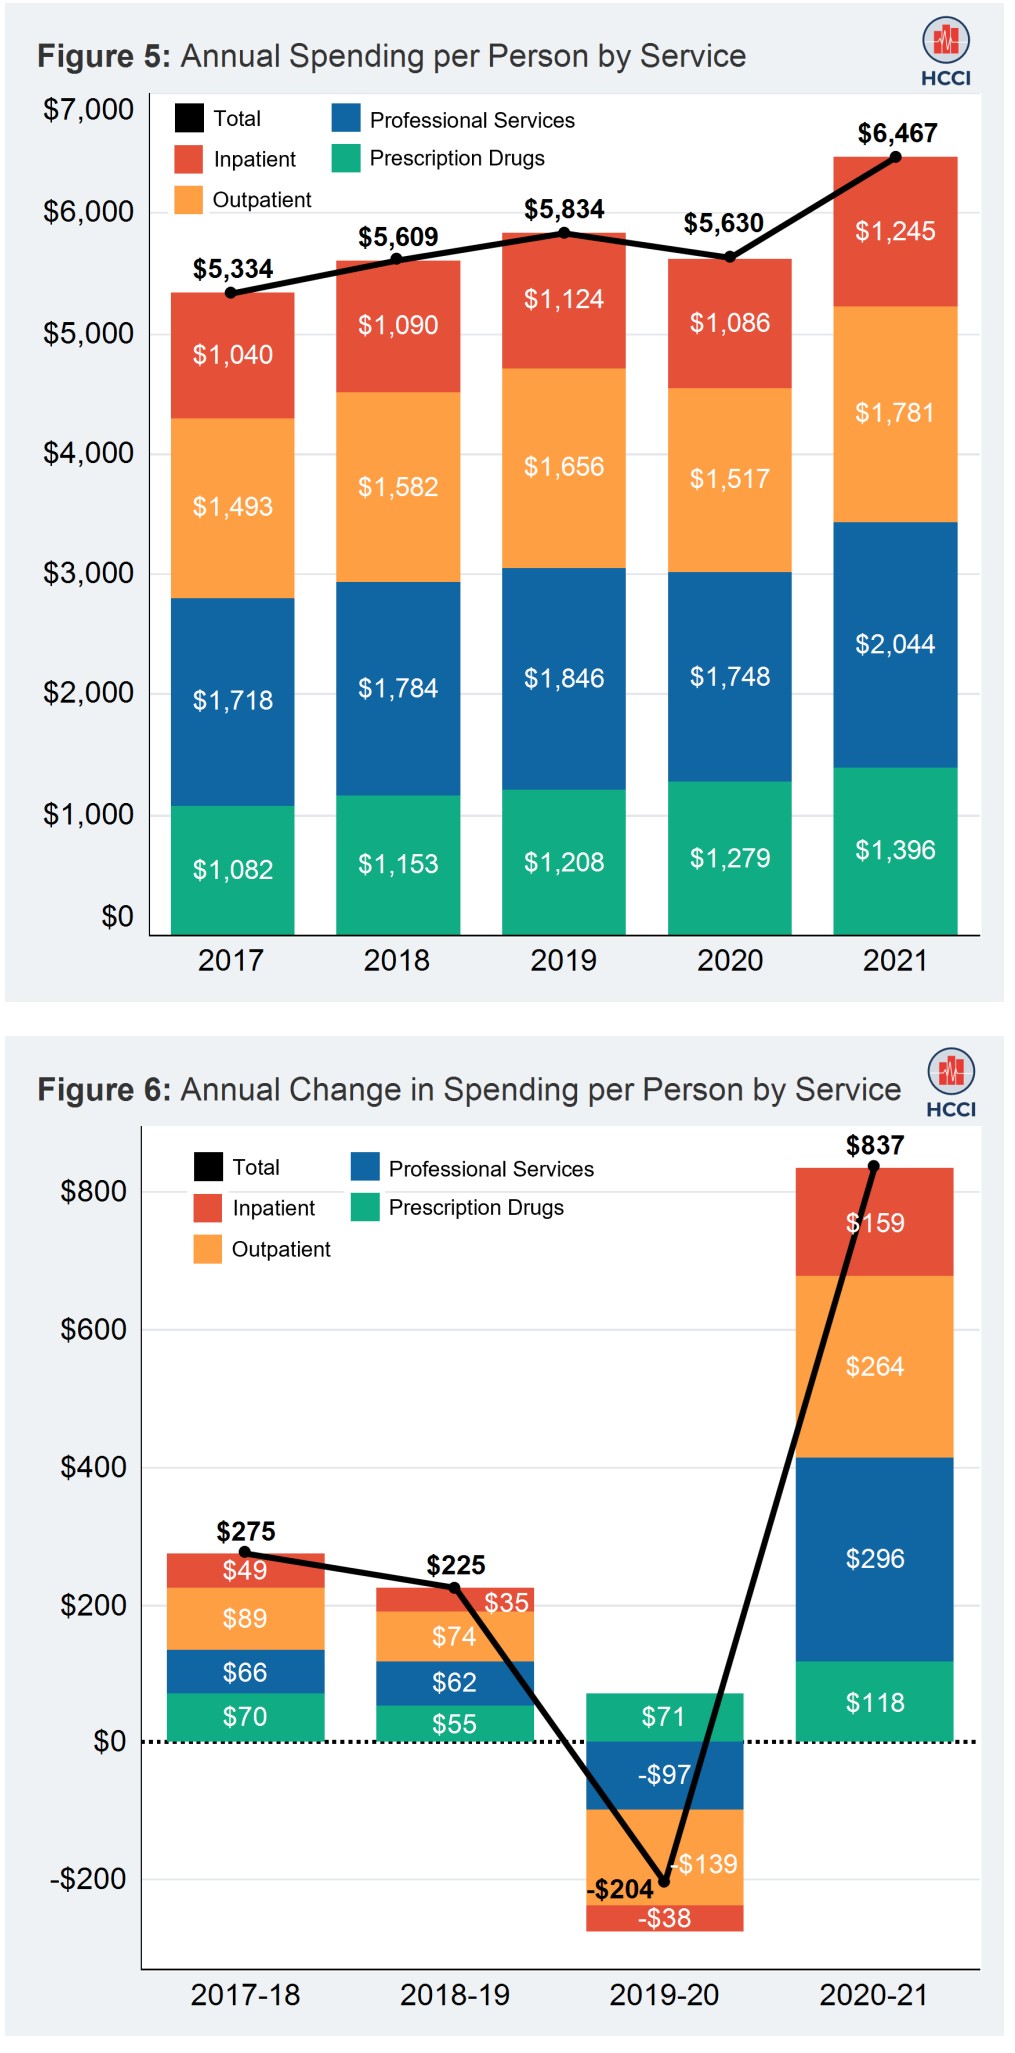
Annual spending per person increased year-over-year from 2017 through 2019, decreased in 2020, the first year of the
COVID-19 pandemic, and then increased in 2021 [Figure 5]. Over the five–year period, spending increased $1,133 per person, an average increase of $250 each year from 2017–2019. This is followed by a $204 decrease in 2020, and a large increase of $837 in 2021 [Figures 5 and 6]
Spending rose in all service categories from 2020 to 2021
The largest increases in spending per person in 2021 were in outpatient and professional services. Following these categories and experiencing the largest decreases in spending per person in 2020 [Figure 6]. Relative to 2020:
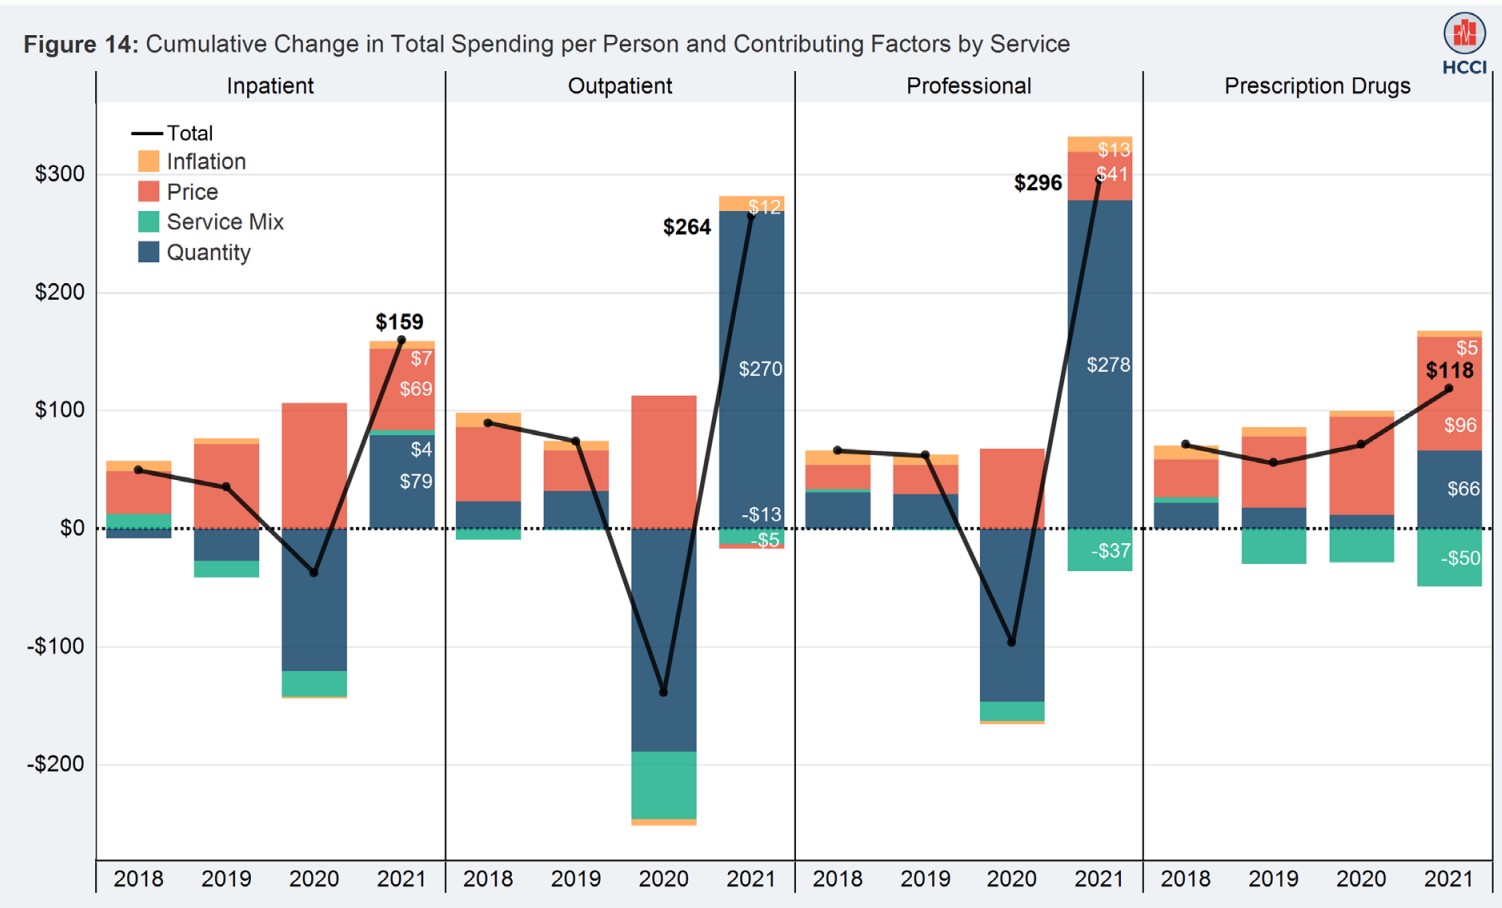
- Per-person spending on facility payments for outpatient visits and procedures increased $264 in 2021.
- Professional service spending per person increased $296 in 2021.
- Per-person spending on facility payments for inpatient admissions increased $159 in 2021.
- These changes are consistent with other evidence that use of health services rebounded in 2021 following a dramatic drop in 2020 during the initial phases of the COVID-19 pandemic.
- Per person spending on prescription drugs rose $118 in 2021. Prescription drugs was the only category with growth in spending in 2020. As noted earlier, this total does not reflect manufacturer rebates.
Annual Changes in Spending, Utilization, and Price
Year-to-year changes in spending are the product of changes in utilization and changes in prices. Between 2017 and 2019, increases in spending largely reflected changes in prices while changes in utilization were much smaller. In 2020 and 2021, the substantial drop in utilization followed by the large rebound in use was the main factor driving spending.
When (AB), this report speaks of utilization, they are also discussing services during a particular period of time. During the Pandemic, unneeded operations, etc. were canceled or rescheduled due to the influx of people infected by Covid. Revenue and profits decreased in 2020. Overhead, mostly did not.
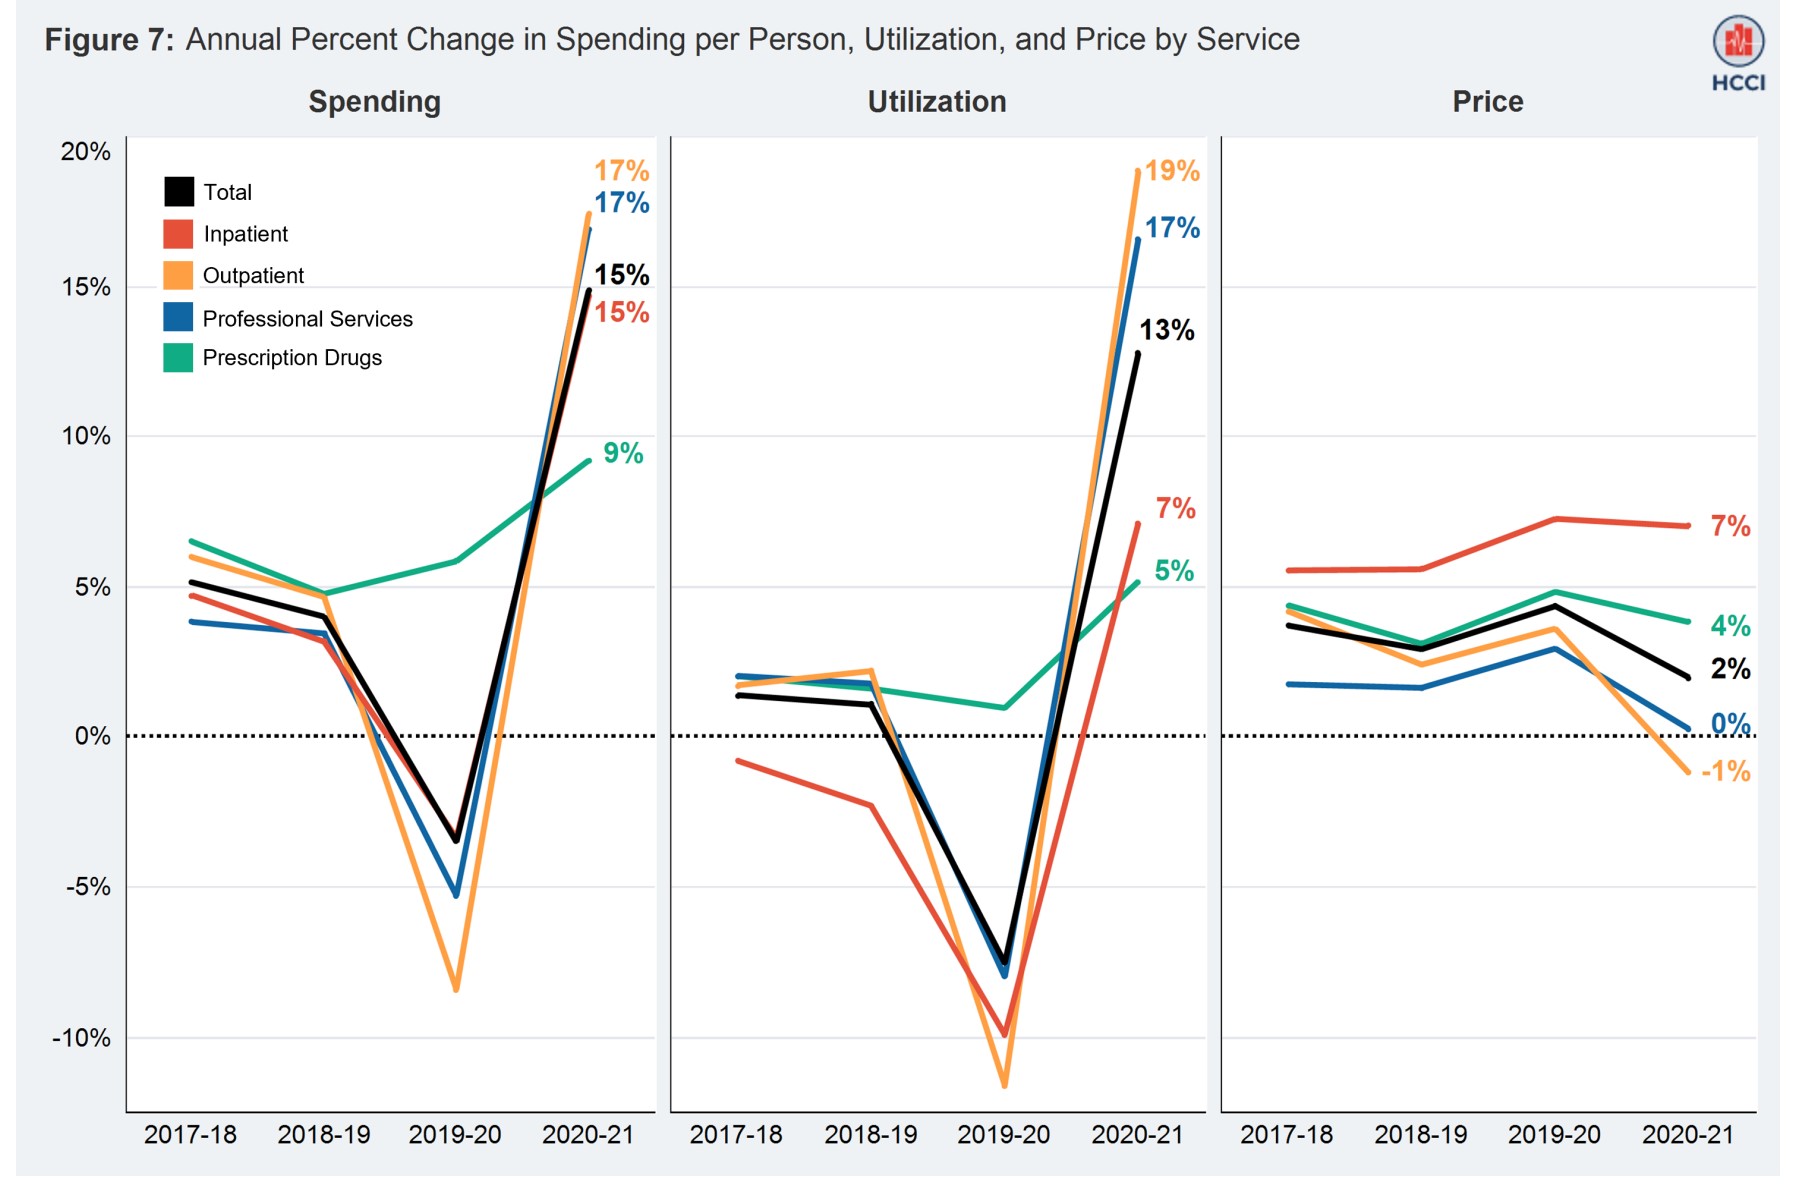
Utilization increased across all service categories from 2020 to 2021, an overall increase of 13% [Figure 7].
- Outpatient visits and procedures experienced the biggest increase, 19%, from 2020 to 2021.
- Inpatient admissions rose 7% from 2020 to 2021. After several years of relatively small increases, followed by a decline in 2020. Utilization of professional services increased 17% from 2020 to 2021.
- Utilization of prescription drugs rose 5% from 2020 to 2021 after modest increases in 2018–2020.
Prices grew 2% from 2020 to 2021, following price growth of around 4% in 2018–2020.
- Inpatient admissions was the category with the highest growth in average prices. Seven percent in 2021, similar to the price change in 2020.
- The average price of outpatient visits and procedures declined 1% in 2021, following rising prices in 2018–2020. This price measure reflects changes in unit prices as well as in the mix of less and more expensive services provided. In 2021, the mix of outpatient services used by ESI enrollees was relatively less expensive as people returned to health care facilities for elective services following the early phase of the pandemic. The average price in this category also reflects growing use of COVID vaccines, a relatively low-cost service, in 2021.
- The average price for a professional service did not change between 2020 and 2021, following a 3% increase in 2020, the highest annual percent change in price for this category between 2017 and 2020.
- Point-of-sale prescription drug prices grew 4% in 2021, slightly lower than price growth in this category in 2020.
Drivers of Health Care Spending, 2017-2021

To better understand what drove the changes in health care
spending per person over the five–year period from 2017 to 2021, the study looked at four factors [Figure 13]:
- General inflation (using CPI-U)
- Service prices
- Changes in the mix of services provided
- Quantity of services
In all years, inflation and prices contributed positively to the
change in spending per person. From 2017 to 2021, inflation accounted for $108 (7%) of the spending change while rising prices accounted for $915 (56%) of the change in spending. This price effect is distinct from price changes due to changes in service mix.
In all years other than 2020, the quantity of services also
contributed positively (though less than prices) to the growth in total spending. Over the 2017–2021 period, the quantity of services accounted for $364 (22%) of the total spending change. Since 2019, the change in the mix of services (within service category) has offset some of the growth in spending. This occurs as the mix of services used by the ESI population becomes less expensive, including the shift from brand to generic drugs.
The relative drivers of spending changes across service categories varied [Figure 14]. Other than for inpatient care, quantity contributed positively to spending changes in medical care categories in all years other than 2020. Prices contributed positively to spending in all years in all categories other than a small offsetting effect of price to
outpatient spending growth in 2021.
There is more detail at the end of this report covering Inpatient, Outpatient, Pharmaceuticals, Procedures, etc. It is a lengthy read replete with more graphs, numerics, and detail. Mostly from this report, a reader might understand what is driving prices and revenue. It certainly was not the pandemic. The shift in 202o was the care of Covid patients rather than surgery or services requiring hospitalization.