Direct Contracting and The Medicare ‘Money Machine’
This is Part One covering Medicare Advantage, Direct Contracting, and the MA Money Machine of which the Risk Scores drive the payout. If the Risk Scoring methodology was eliminated, ~$355 billion over the next eight years if just the risk-score related overpayments were eliminated.
This is a pretty good read if you have the patience to cover all of it. I have added acronym and other definitions at the bottom. I have also added some additional reading on HCC coding which determines risk. The Part Two site is listed also if you wish to get ahead of me. I will try to have Part Two completed by Sunday evening.
I have done some editing of parts of the commentary, added some commentary/explanation and generally tried to make it more understandable. Just a heads up.
Medicare Advantage, Direct Contracting, And The Medicare ‘Money Machine,’ Part 1: The Risk-Score Game, Health Affairs, Richard Gilfillan and Donald M. Berwick.
During the Covid-19 pandemic, another epidemic was raging in the medical world and has been for the past two years. It is being fought, in the areas of financing and acquisitions of firms focused on serving Medicare beneficiaries. The service of which has grown in value since 2012 when CMS started to rate various insurers. The firms include Primary Care Practices1 (PCPs); management services organizations (MSOs) aggregating practices; and Medicare Advantage (MA) insurers. Not much of a surprise on the last organization.
There is also no surprise as to where this battle is being fought and who this battle is about.
In this arena, the combined activity of private equity and venture capital firms, initial public offerings, special purpose acquisition companies (SPACs), and insurance company purchases of MA-focused firms has soared. As the article notes more than $50 billion in valuation has been created in the past 18 months (pre-this article), dwarfing the speculative bubble for physician practice management companies in the 1990s.
An indicator of the exuberance underlying this “Medicare Gold Rush” is the amount per covered life implicit in a firm’s overall valuation. Historically, per-life valuations in MA have ranged from $4,000 to $10,500.
Exhibit 1 shows per-life valuations for a sample of recent transactions.
The average is $87,000 per beneficiary. Most of the firms acquired or financed are PCPs or MSOs that typically produce no margins—just an average take-home income of $240,000 per physician. The first six are participants in the Centers for Medicare and Medicaid Services’ (CMS) new Direct Contracting Model, which we shall discuss further in Part Two of this post.
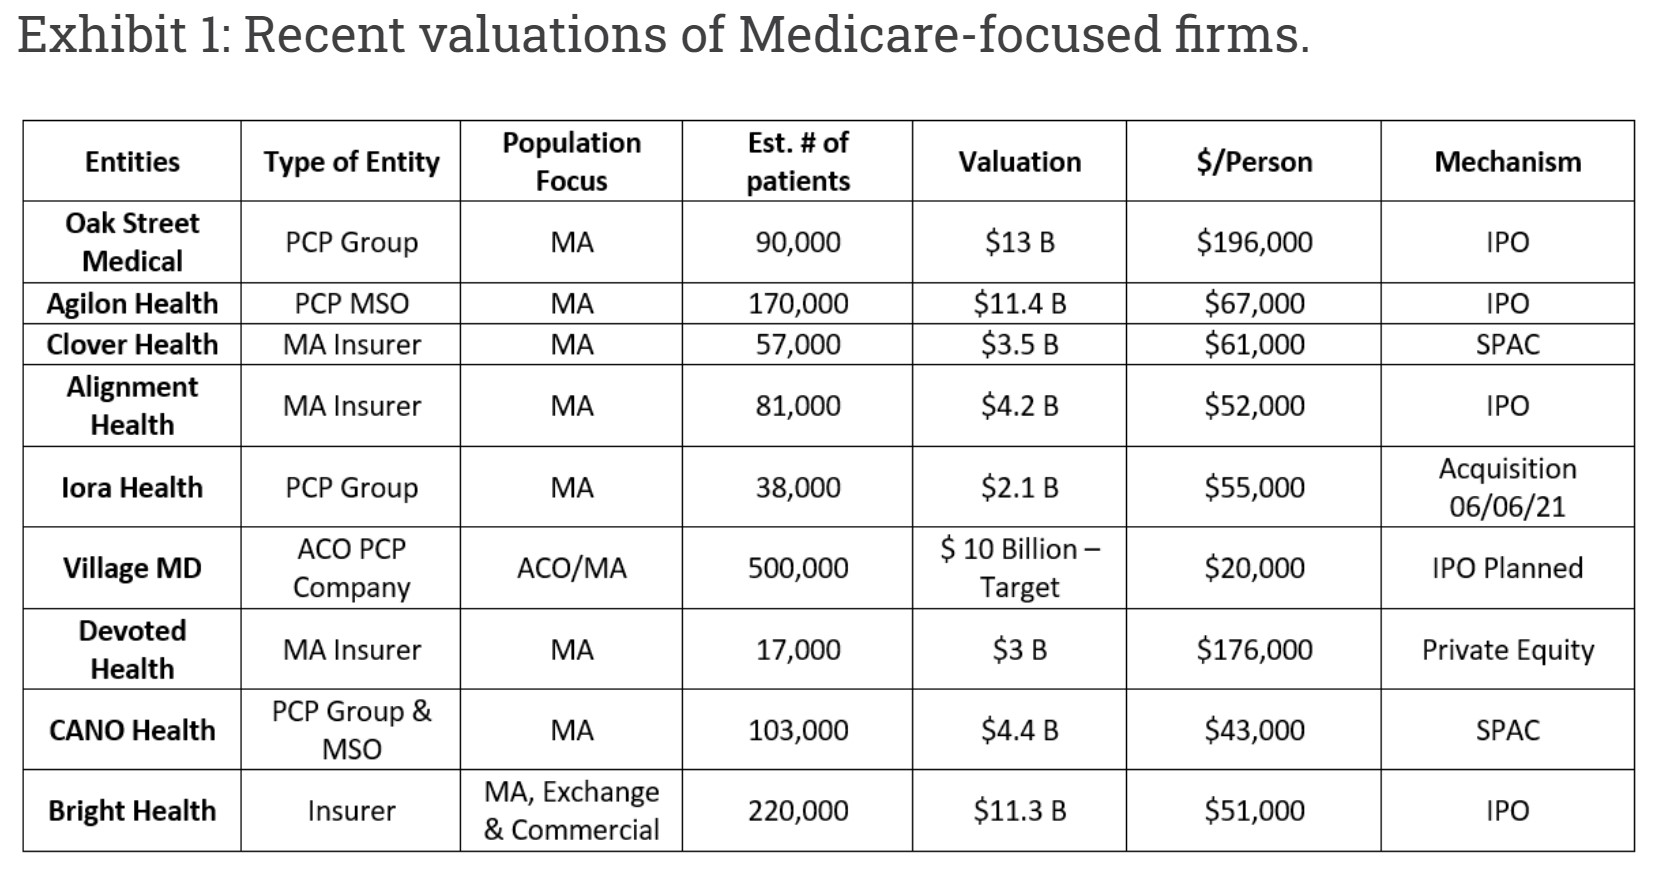
Source: Authors’ analysis of publicly available information
If these valuations for PCP Practices and MSOs look hard to believe, it is because they are.
Annual Medicare Part A and B spending per individual is roughly $12,000. PCPs1 typically receive only 5 percent of that amount. This leads to understanding the logic an investor may gamble at a rate equal to almost eight times the total annual health care expenditure ($12,000) per capita for PCPs with no margin? Investment at this level is smoke; what is the fire?
In this two-part post, the authors attempt to explain the MA business model underling this elevated level of investment. It will explore its connection to the Direct Contracting2 model now being tested by CMS. The story is complex. But we think it is worth telling because the stakes for beneficiaries, the public treasury, and our health care system are very high. This business model is distorting health care delivery, creating excessive costs for taxpayers and Medicare beneficiaries, draining the Medicare Trust Fund, obstructing the badly needed value transformation of American health care, and diverting the money needed to fund other social services and goods.
Part one of this post focuses on MA. Part two, will discuss Direct Contracting and suggest some reforms for both MA and Direct Contracting. We also offer a broader reform agenda that calls for expanding the accountable care organization (ACO) model by working directly with providers, rather than investors.
The Marketplace And Business Model Of Medicare Advantage
Four main business realities drive the interest in Medicare-related acquisitions.
First is the expected doubling of Medicare spending from $800 billion in 2019 to $1.6 trillion in 2028 as Baby Boomers age.
Second is the reality that MA harbors an arbitrage game in which CMS overpays MA Plans without achieving demonstratable clinical benefit to patients.
When such adjustments are made, it is clear that Medicare spending for MA beneficiaries exceeds that for comparable FFS beneficiaries.
Third is the heavily subsidized and distorted market dynamics that result from these overpayments.
Fourth is the Trump administration’s creation of the Direct Contracting Model2 as a vehicle for privatizing Medicare’s projected 2028 $1.6 trillion spend.
The Magnitude of MA Overpayments
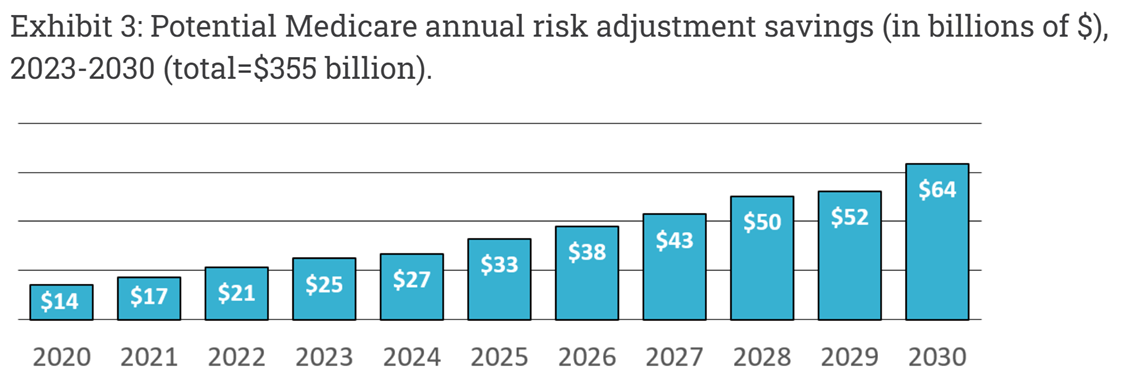
Exhibit 2: the Medicare Payment Advisory Committee (MedPAC) has documented ~ $140 billion in MA overpayments over the past 12 years. MedPAC further concludes that risk adjustment overpayments are currently increasing. Kronick and Chua have estimated savings at $355 billion over the next eight years if just risk-score related overpayments were eliminated. (Exhibit 3)
Exhibit 2: MA overpayments (in billions of $) due to quality system, benchmark policy, and risk adjustment scores (total = $143 billion).
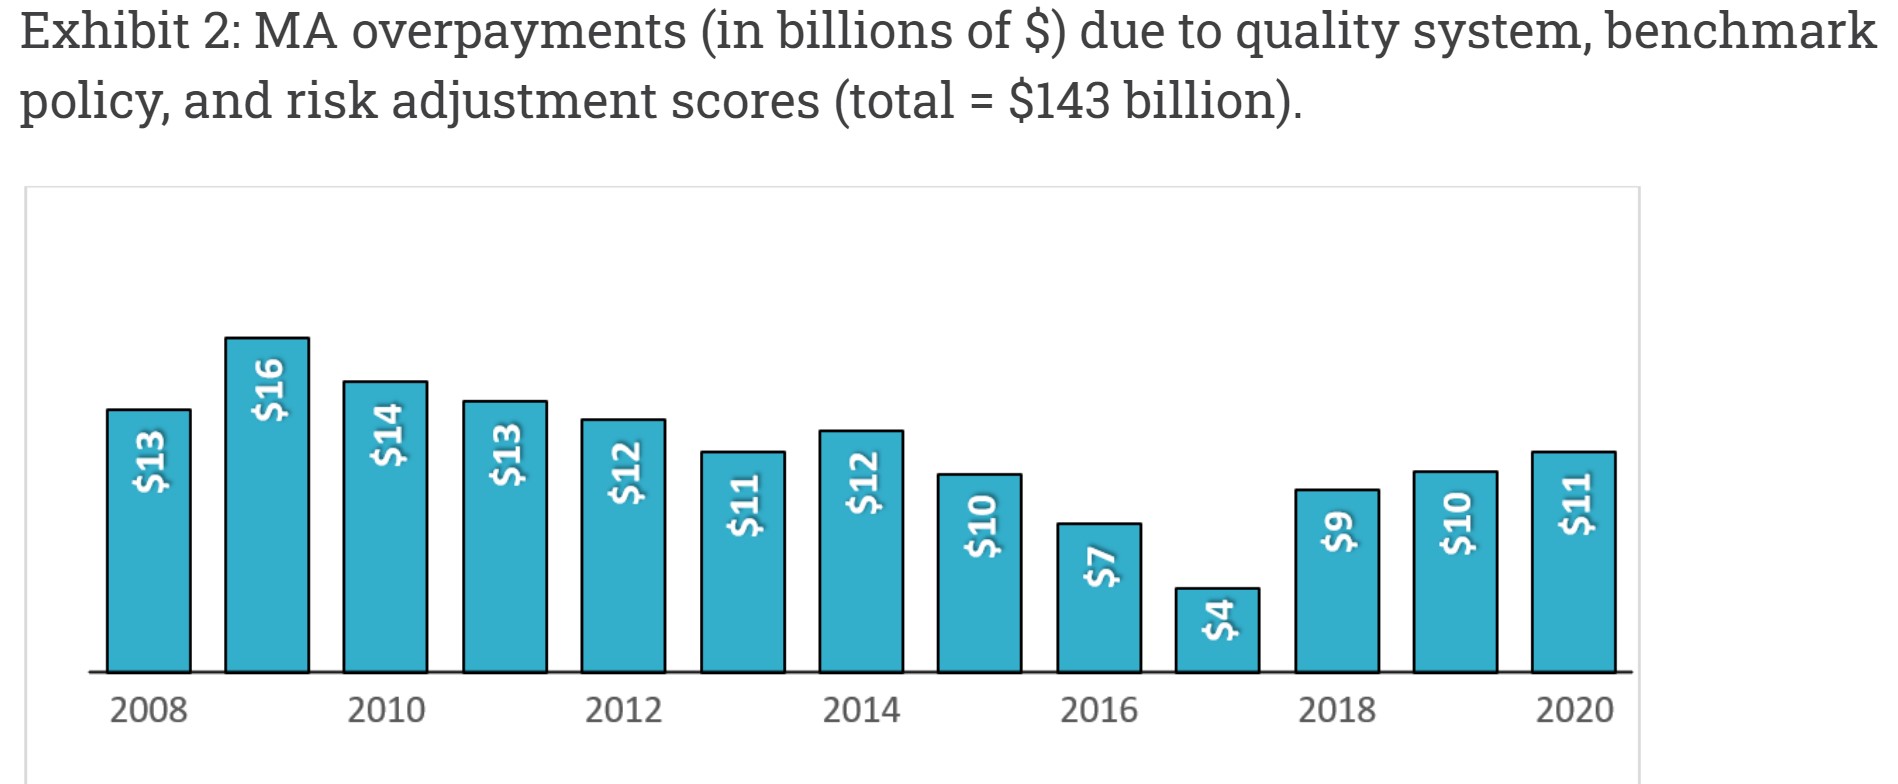
Source: The MedPAC Blog, March 3, 2021 (authors’ conversion of MA overpayments to dollars from percent of FFS payments as calculated by MedPAC)
Source: Estimating Impact of Coding Intensity Adjustment: Exhibit A.7, DECI (Demographic Estimate of Coding Intensity) p.28
MedPAC has documented MA plans’ ability to obtain overpayments by cherry picking counties with favorable benchmarks and escalating quality bonus payments through contract manipulation. These tactics add 8 percent in program costs in 2021, leading to MA payments 2 percent above fee-for-service (FFS) Medicare payments. MedPAC has made important recommendations to Congress to address these issues. The authors will focus primarily on the “risk-score gaming” increasing MA payments and the resulting marketplace dynamics impacting health care delivery across America.
The Dynamics And Worth Of MA Risk Adjustment System Overpayments for Plans: Risk-Score Gaming
The shortcomings of CMS’s Hierarchical Condition Category3 (HCC) risk adjustment system have been well described since its full implementation in 2006. Simply stated, MA plans can draw enormous overpayments by submitting diagnosis codes creating more HCCs per person. While the codes are, presumably, accurate, the dollar coefficients used in MA payment logic are inflated because they were modeled using markedly under-coded FFS data. “Risk-score gaming4” overpayments come from inaccurate pricing of HCCs. Congress and every administration since 2006 have avoided fixing this inaccuracy, in part because of plans’ enormous political clout.
Exhibit 4 illustrates how the MA bid model rewards increased coding. (Part D costs are excluded). Total CMS Premium includes two pieces. One is the Plan bid to provide A and B services including profit and administration, multiplied by the risk score. The other is a rebate Medicare pays to the plan, calculated on average as 65 percent of the amount it bids below the risk adjustment benchmark; CMS retains the other 35 percent. Both pieces increase as the risk score goes up. The A and B Medical Expense in each column is unchanged since the population is the same.
Column A shows the resulting financials for a 2021 average plan described by MedPAC. Despite the 1.0 Risk Score, Medicare pays roughly 1 percent more than FFS, due to the benchmark and quality issues noted above. Column B illustrates the theoretical results for a very highly competitive market where the Plan uses most extra revenue to increase rebates, not profits. CMS overpayments increase by $58 million annually per 100,000 beneficiaries, with beneficiaries paying $12 million more in Part B Premiums.
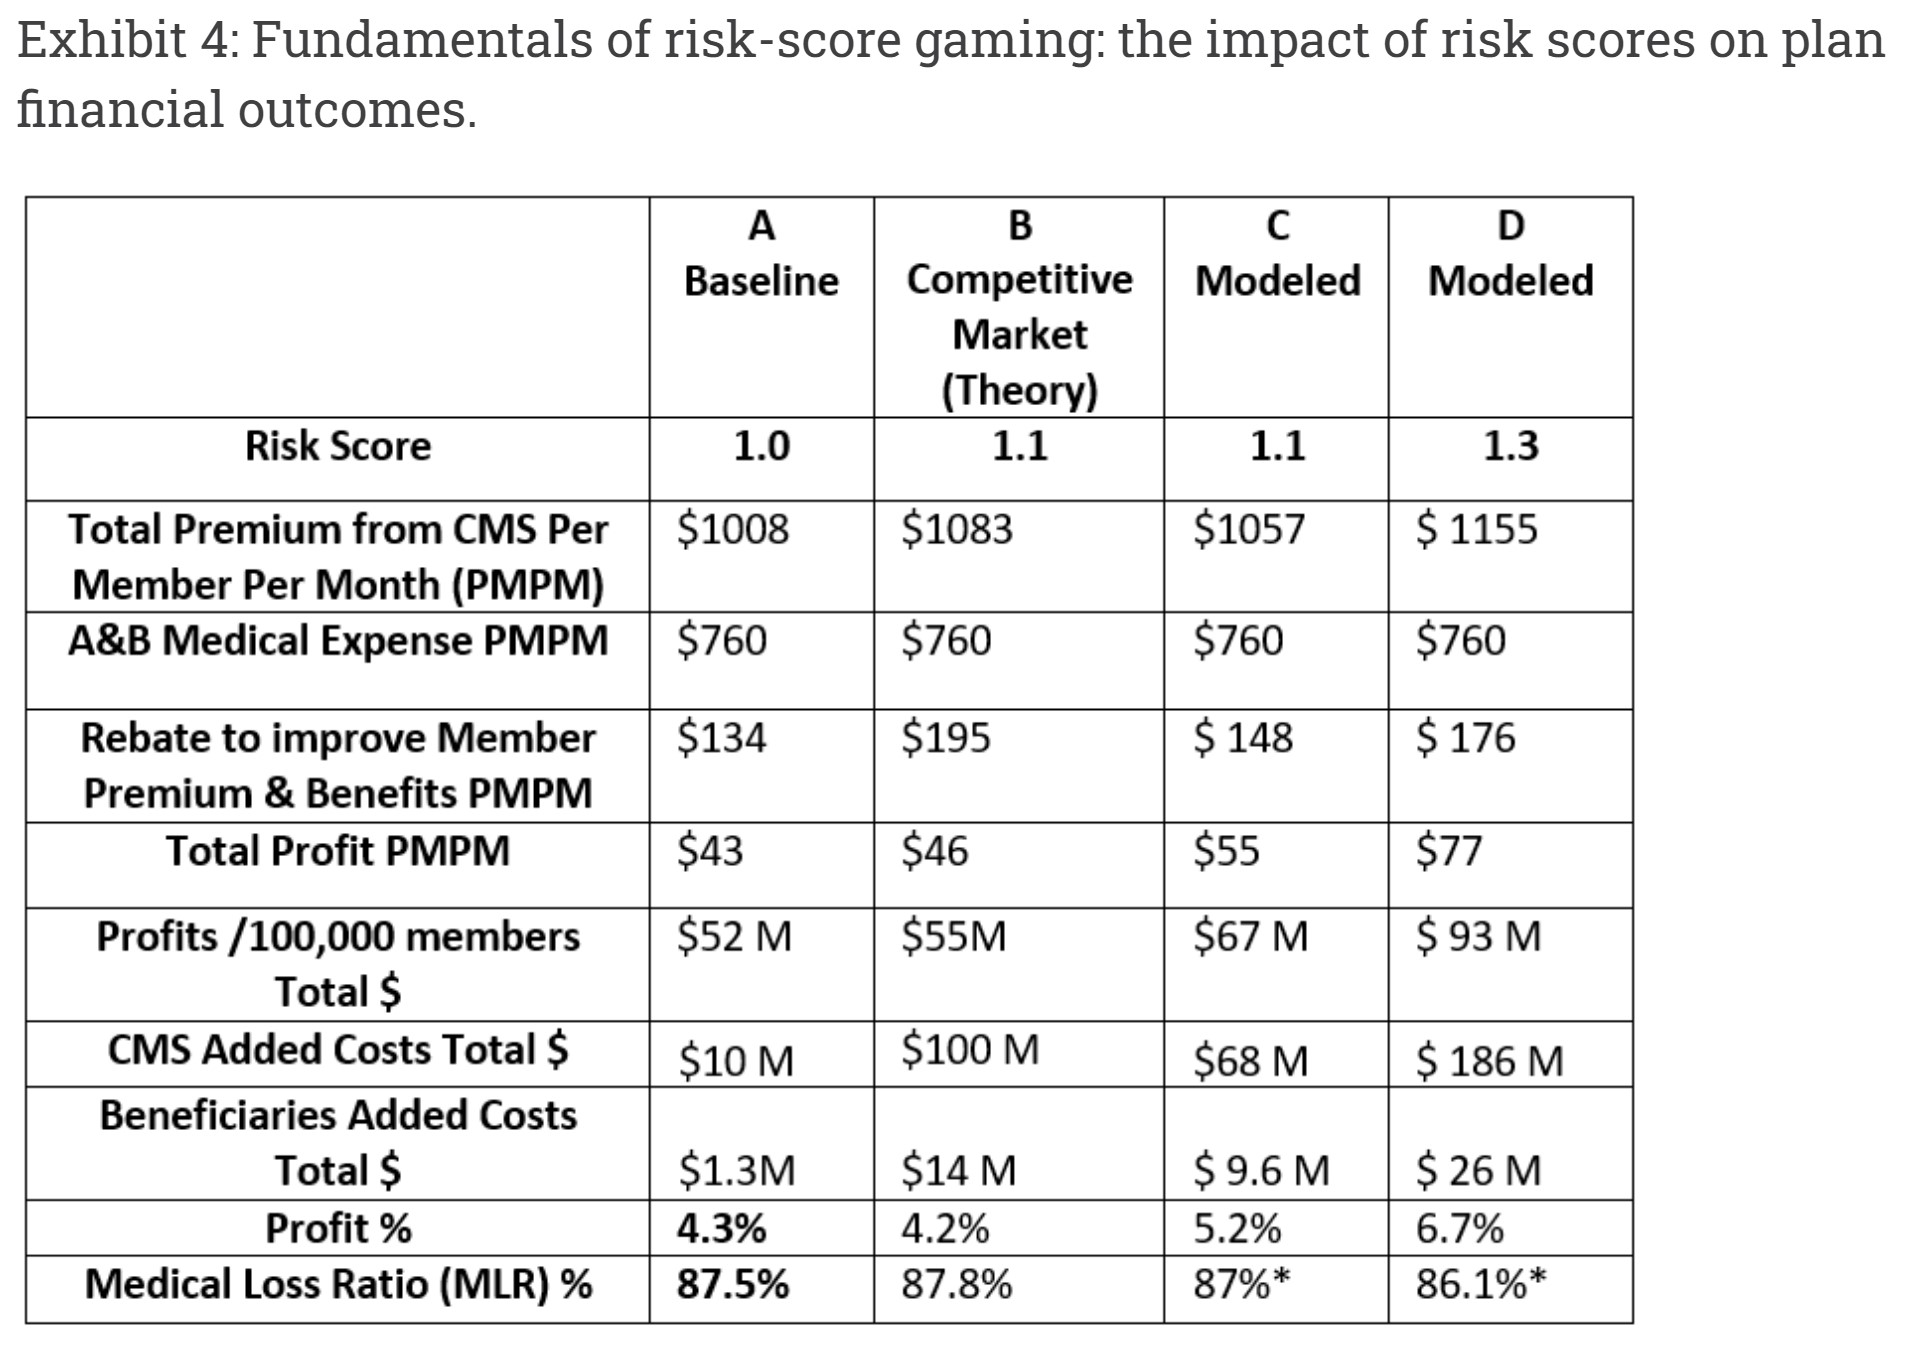
Source: Authors’ model. MLR includes additional expense for code collection.
Researchers in multiple studies have demonstrated MA markets are not so competitive. Plans tend to use additional revenue to improve profits more than member benefits. Plan bid documents are not public, so we cannot show this directly. Columns C and D in exhibit 4 result from our more conservative model based on MedPAC’s 2021 Bid Analysis and Jacobs and Kronick’s empirical analysis. The resulting estimates are that for each 0.1 increase in risk score, an average plan would use roughly $11 PMPM5 for profit and $14 to improve premiums and benefits. For each 0.1 increase, estimated profits increase about 25 percent, Medicare overpayments for 100,000 beneficiaries increase by $58 million, of which $8 Million will be paid by Part B beneficiaries. Individual plans’ actual use of risk score revenue will vary widely depending on their strategic weighting of profitability vs. growth.
The Demographic Estimate of Coding Intensity (DECI) estimates in exhibit 3 include a 2021 MA coding intensity difference of approximately 0.13. Projected across the MA population of 26 million, each 0.1 increase in risk scores in our model results in an additional $15 billion in overpayments and $3.5 billion in additional MA plan profits at current enrollment levels. CMS would pay $13 billion of the over-payments and Medicare Part B beneficiaries would pay the other $2 billion in inflated Part B premiums. Risk-score gaming creates a major transfer of wealth from taxpayers and Medicare beneficiaries to MA plans, and it lies at the heart of the business model for most MA plans.
The Perverse Marketplace Of Medicare Advantage (why is MA bad?)
Supporters of MA point to the program’s growth as evidence that the privatized model works. The reality is that MA grows because the structural and risk-score gaming overpayments subsidize MA plans to offer some improved benefits, lower Part D costs, an average $5,000 out-of-pocket cap, and underutilized supplemental benefits. Low-income beneficiaries remain underinsured and subject to significant copayments and deductibles. As plans code more, risk scores go up, CMS provides more subsidies, benefits and premiums get better, and buyers choose the improved plans that cost taxpayers more. This is one distorted dynamic in the MA marketplace: the costlier the plan is to the payer (CMS), the easier it is to sell it to the customer, and the greater the profit.
Subsidizing the marketplace is the major reason that over the past 15 years MA plans have been by far the most popular form of health insurance company start-ups. Firms that initially targeted other segments, such as the exchanges (viz. Bright and Oscar) or Medicaid (viz. Centene and Molina), have all found their way to MA as their preferred business opportunity. Most recently new MA startups have been prominent, including Clover Health, Devoted Health, and Alignment Health.
One potential restraint on risk-score gaming is that as risk scores go up plans begin approaching the 85 percent Minimum Loss Ratio requirement under the Affordable Care Act. Plans have found a solution for that, which we label the “MA Money Machine6,” the next major component of the distorted MA Marketplace.
How The “MA Money Machine” Works
Given the dollar magnitude, risk-score gaming becomes a central part of every MA plan’s strategy. The starting point is to get as many diagnosis codes as possible. An entire industry been created to do just that, leading to billion dollar valuations for firms, like Signify Health, providing analytical tools to enable coding efforts or make home visits for plans and providers. Most Plans now use Artificial Intelligence (AI) HCC Tools to identify coding opportunities.
In a recent investor call, United Health remarked on the importance of home visits, noting, as the COVID pandemic waned, their HouseCalls nurses were back in the home collecting diagnoses leading to improved profits in their MA plans. MedPAC and the HHS Inspector General have identified these home visits as key drivers of overpayments. But MA plans know that the best sources of more codes are providers. They have developed three well-established schemes to get more codes directly from providers, which we call “Deal 1,” “Deal 2,” and Deal 3.”
Provider Coding Deal 1: Pay Providers For Submitting More Codes
Some plans pay providers to code more diagnoses by using pay for performance metrics like HCC Gaps Closure and Recapture Rates and using AI tools to direct their efforts. Clover Health simply pays MA (and now Direct Contracting) physicians $30 per visit to use its “Clover Assistant” AI platform, which identifies coding opportunities.
Provider Coding Deal 2: Share The Risk Premium With Providers
Many MA insurers distort the value-based care (VBC) contract model to make it a vehicle to drive more coding. Column A in exhibit 5 illustrates the results of a legitimate value-based contracting approach similar to that used in Medicare ACOs. A medical expense target is set based on historical experience. If actual costs are less than historical costs, the provider keeps a portion of savings, contingent on quality-of-care metrics. ACOs operating under VBC models have saved CMS $1.9 billion in 2020 and more than $4 billion over the past eight years.
Column B, C, and D in Exhibit 5 show how MA plans distort VBC contracts to increase CMS costs. These MA “non-value-based care” contracts sets the target based on a percentage of the premium the plan receives for a provider’s panel of patients. The provider has good reason to focus on increasing the risk score. In column B, the risk-score increase of 0.1 drives higher premium, the target goes up, and the resulting contrived “medical cost savings” of $56 PMPM, without any actual change in costs or care, “drop through” to become provider profits. Insurer profits increase as well, since insurers collect 15 percent of a larger premium. CMS ends up paying $120 million more and beneficiaries pay for $14 million in Part B premiums.
Columns C and D show how each 0.1 RAF increase creates $87 PMPM5 more in Part A and B revenue, with $71 going to the provider and $15 to the plan, which can use it as profit or to improve benefits. Rebates go up $14 PMPM as well, due to the benchmark increase. Column D also shows that, any decrease in medical costs just becomes additional profit. CMS shares in none of the savings, and costs still go up $370 M in total per 100,000 beneficiaries.
These MA Percentage of Premium contracts create a continuous “Money Machine6” allowing the provider firm and plan to harvest a financial windfall just by finding more codes. As a result, providers look hard for diagnoses using various AI-enabled platforms. A current popular tactic, for example, is to screen beneficiaries for peripheral vascular disease7 (HCC 108), which delivers an extra $2,800 per year per patient, by ordering carotid ultrasound studies, even though the US Preventive Services Task Force recommends against such screening for the general population.
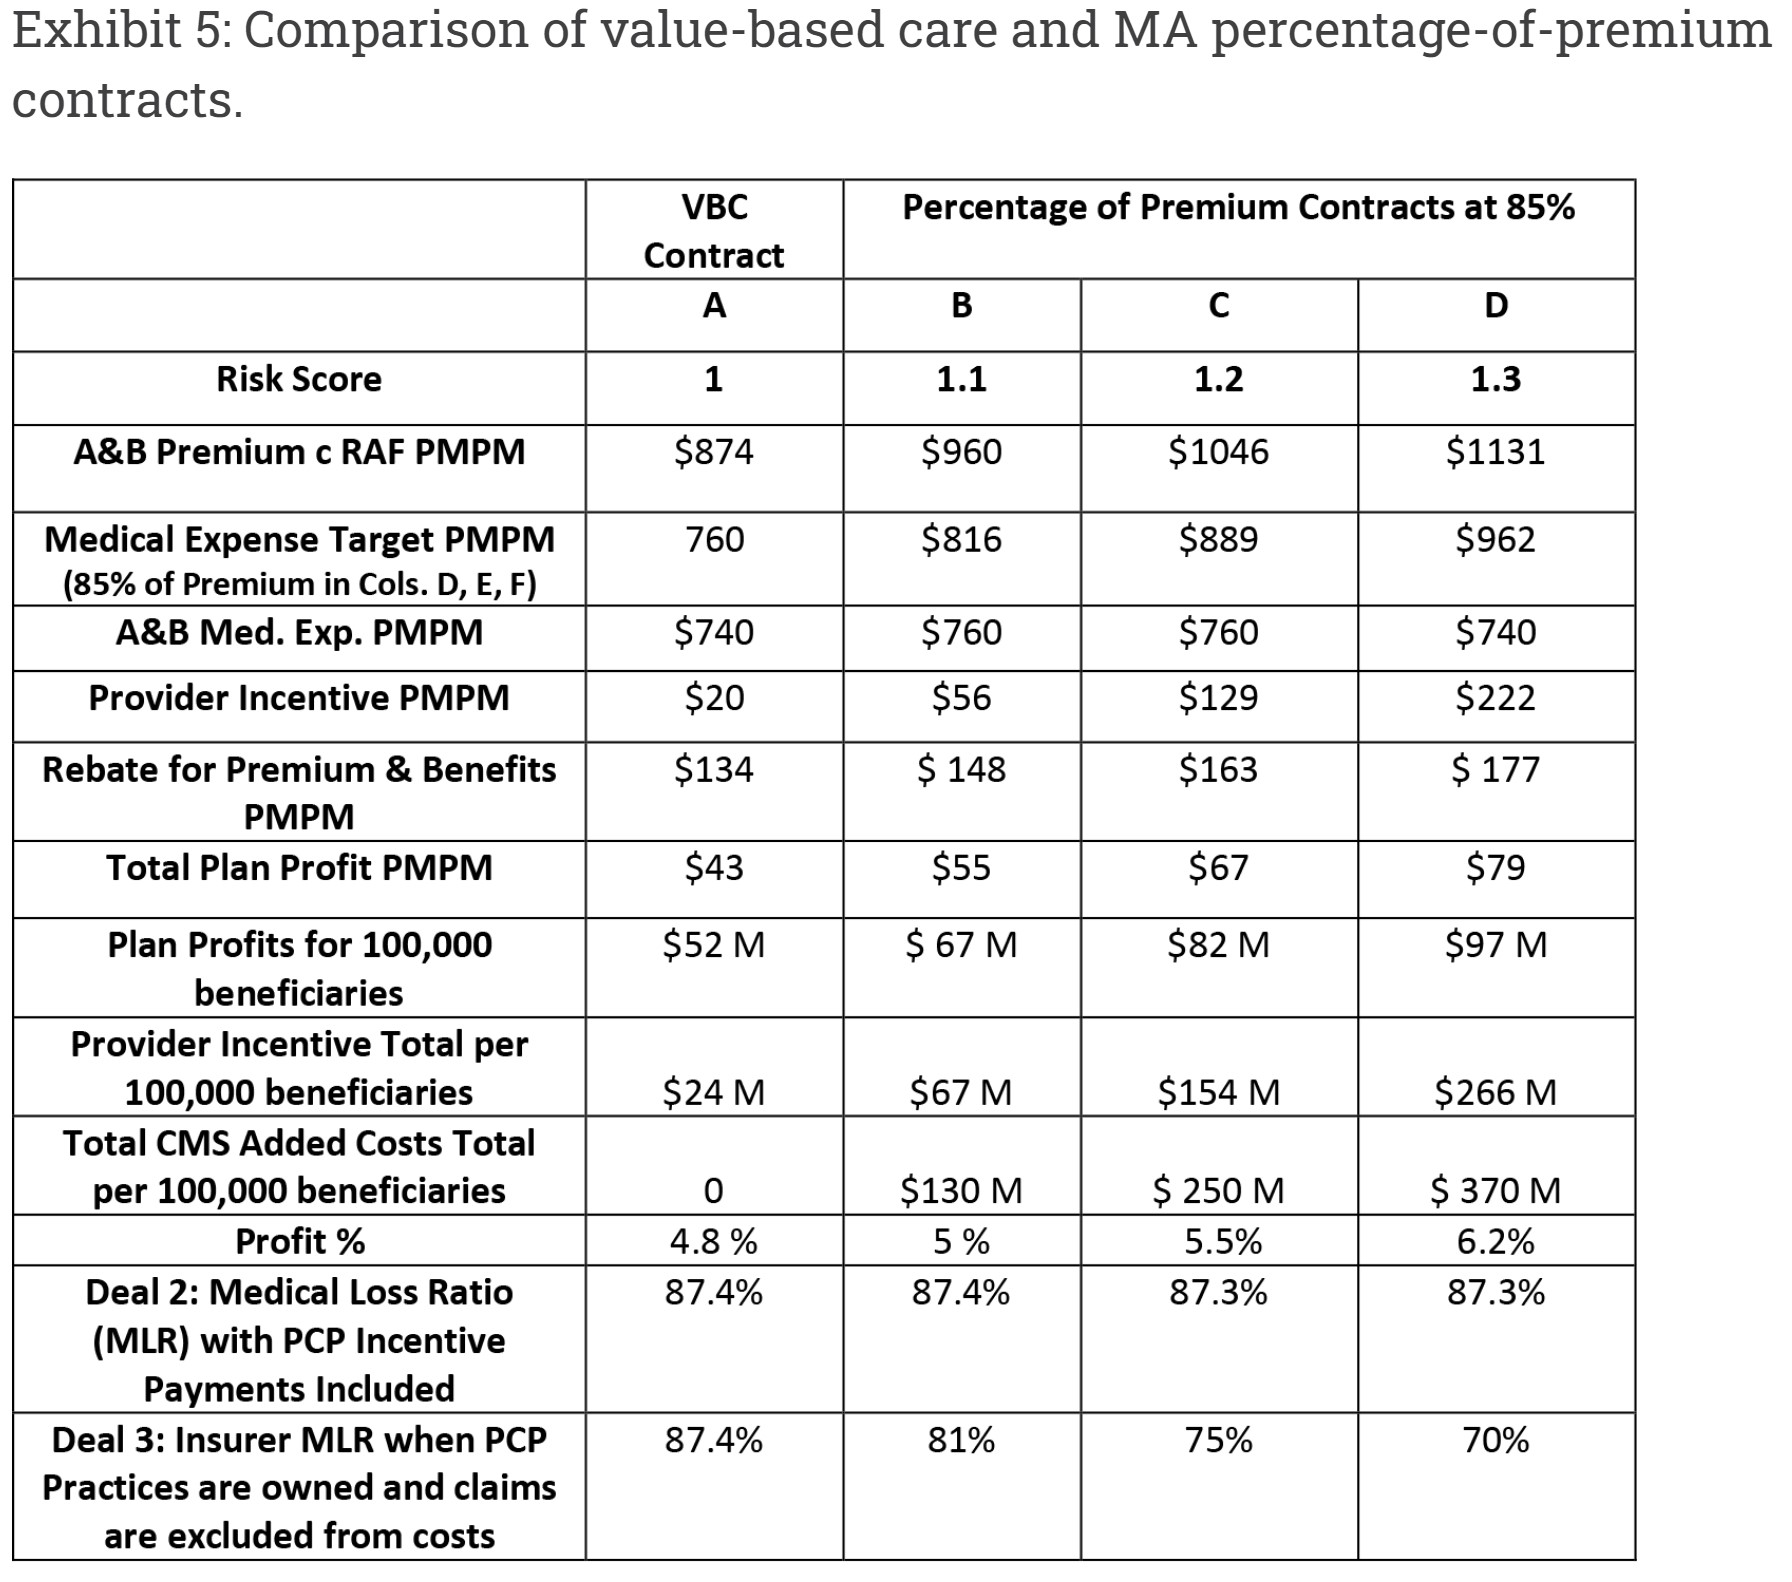
Source: Authors’ analysis
Key points comparing Deal 1 provider payment tactics (in exhibit 4) to Deal 2 Percentage of Premium contracts (in exhibit 5) include the following:
- CMS overpayments in Percentage of Premium contracts in exhibit 5 are almost double the overpayments in the risk-score gaming model in exhibit 4, because CMS does not share in the phantom “Medical Cost Savings” as they do with rebate calculations.
- Extrapolated across the entire MA population Percentage of Premium contracts increase costs by $30 billion, or 10 percent, for every 0.1 increase in RAF score.
- The financial returns for providers in Deal 2 are enormous. Providers can reach 400 percent or more of usual PCP payments, and provider profits can reach more than 200 percent of plan profits.
- Rebates under Deal 2, although not as high as in the Deal 1 risk-score gaming model, still increase, facilitating enrollment growth.
- Any medical cost savings simply drop through to become more provider incentive payments rather than savings to CMS.
- The 85 percent MLR requirement is enfeebled because the extra claims keep the MLR high.
Provider Deal 3: Own The Providers
Recognizing that the largest share of the MA Money Machine profits goes to providers, some insurers have decided to own the providers outright. This tactic ensures optimal use of their sophisticated AI coding by employed staff. The parent collects both the insurance profits and the Money Machine profits. MedPAC raised the issue of whether plans with Deal 3 arrangements may be inaccurately reporting related provider incentive payments in ways that overstate medical expenses. The final row in exhibit 5 demonstrates that if such claims, which could ultimately result in profits for the plan, were excluded, the actual MLR could be in the low 70s.
United Healthcare, the most profitable of the large national MA Plans, seems to have used Deal 3 for seven years following the purchase, through its OptumHealth subsidiary, of Monarch and Applecare PCP Networks in 2014. With over 50,000 physicians owned or in affiliated independent practice associations (IPAs), United may today be the largest employer of physicians in America, and it plans to add 10,000 more physicians in 2021. The Money Machine model was described as a core driver of profitability in a recent United Healthcare C-Suite fireside chat: “OptumHealth . . . revenue per consumer served increased 29 percent for 2020 driven by expansion . . . in value-based care arrangements and increasing acuity of the care services provided.”
The Current Status Of The MA Money Machine
Over the past 15 years, the MA Money Machine has been growing as an essential business model component for many prominent physician groups, IPAs, PCP/MSOs and even some integrated systems. United Healthcare and Humana today control 12 million MA lives, almost 50 percent of the national total. Both are rapidly expanding their use of the MA Money Machine. Humana reports that two-thirds, or 2.4 million, of its individual beneficiaries are in these models. They have relied on Deal 2 historically, but recently announced the creation of Centerwell as their new Money Machine Deal 3 vehicle. United Healthcare, with a particular focus on acquiring non-profit physician groups like Reliant and Atrius Health, has said that Optum now has 2 million of its MA lives in “Value-Based Contracts” and is rapidly increasing that number. Thus at least 4.4 million people, or 17 percent of all MA members, and almost $60 billion, are involved in Deal 2 or Deal 3 Money Machine contracts today, with rapid growth ahead.
Exhibit 6 (modeling a hypothetical physician’s panel of 400 MA patients) illustrates how these contracts turn break-even primary care practices into very profitable “assets” that have attracted the attention of private investors
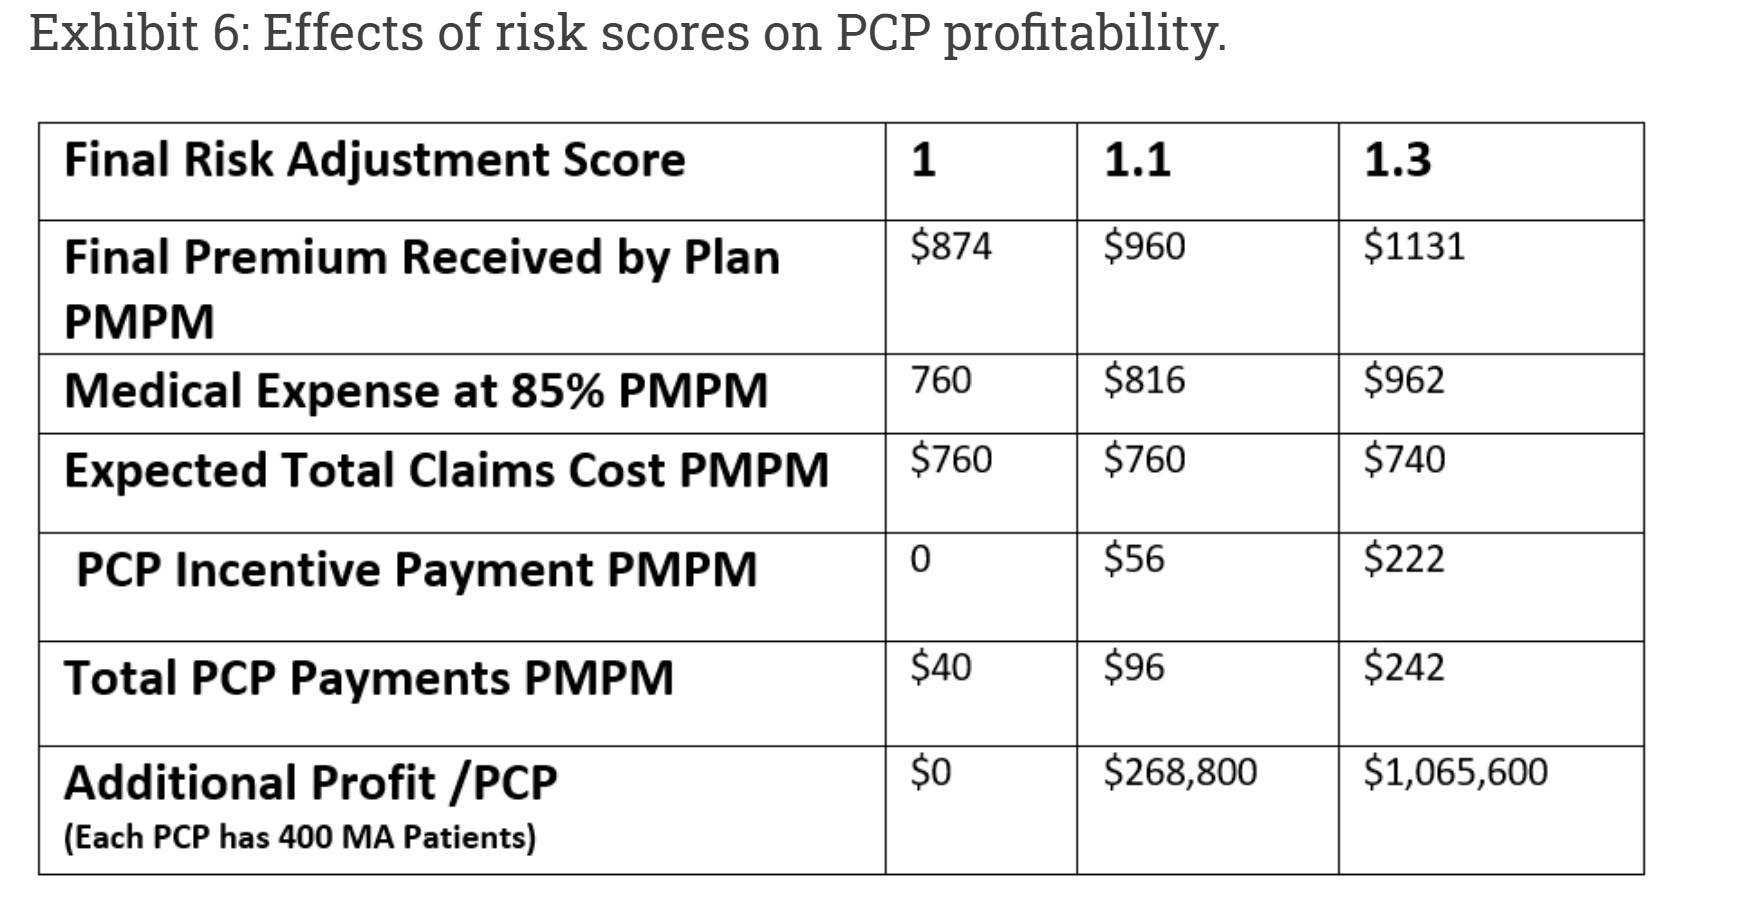
Source: Authors’ analysis
Over the past eight years a number of new start-up venture capital backed PCP firms have been created using the Money Machine as their core business model. They share many common features:
- Primary, if not exclusive, focus on MA patients, not traditional FFS patients.
- A business model driven by “Percentage of Premium” MA contracts (Deal 2).
- A high-touch clinical model focused on coding and decreasing medical costs.
- Easy PCP access using low patient-to-provider ratios, open appointments, and free transportation to the office.
- Proprietary AI-based digital platforms that drive high risk scores, in the 1.3 – 1.7 range (according to former employees).
- Deep relationships with one or more MA plans, some of which have funded new practice sites.
Recent PCP and MSO partnerships with Humana, for example, include Iora, Oak Street, Agilon, Cano Health, and Landmark. VillageMD has partnered with Aetna/Anthem, and ChenMed has partnered with Independence Blue Cross. As shown in Exhibit 1, financing for these firms has been extraordinary. Another set of PCPs and MSOs are following closely behind, including Miami Beach Family Practice and several other Direct Contracting Entities (DCEs). The primary business model for all is the MA Money Machine.
Why the rush of investors into MA primary care space? Because it is an MA Money Machine. While all can agree that we should improve compensation for primary care, these extraordinary profits are more likely to be captured by the for-profit parent entities rather than passed through to physicians delivering care.
The toll of the MA coding game, though high, has heretofore been confined to the MA portion of Medicare, that is 42 percent of all CMS beneficiaries. Under the Trump Administration, that changed.
The Trump Administration avowed its intention to de-risk CMS by moving the 58 percent of Medicare beneficiaries who chose traditional coverage into MA-like full risk capitated arrangements.
This full privatization of Medicare coverage would require new entities to act as financial intermediaries between CMS and non-MA beneficiaries. CMS officials decided the same firms that benefiting from risk-score gaming overpayments in MA—insurers and MA-focused Primary Care Firms (PCF’s)—should be given the opportunity to manage the $350 billion in Medicare spending for the majority of beneficiaries not in Medicare Advantage. They needed a new program to accomplish this overarching goal. The Direct Contracting Model was announced in April of 2019 as the vehicle.
Part two of this post will explore the shape and implications of the Direct Contacting model, and then will offer some ideas to remedy or mitigate some of the untoward consequences of the Money Machine.
Some Definitions
1 PCP: A physician who provides both the first contact for a person with an undiagnosed health concern as well as continuing care of varied medical conditions, not limited by cause, organ system, or diagnosis.
2 Direct Contracting (DC) model. Transfers cost and care management to private for-profit insurer and investor contracting entities. CMS auto-assigns more than 30 million beneficiaries who have chosen traditional Medicare. DC entities are managed by private for-profit companies, without their understanding or consent. These are similar to Medicare Advantage plans even though the enrollees explicitly rejected this type of coverage. Although not technically permissible, contracting entities could shift enrollees to Medicare Advantage.
3 Hierarchical Condition Category (HCC) coding is a risk-adjustment model originally designed to estimate future health care costs for patients. (read the link for further explanation).
4 “Risk score gaming creates a major transfer of wealth from taxpayers and Medicare beneficiaries to MA plans, and it lies at the heart of the business model for most MA plans” as well as our claim that the Centers for Medicare and Medicaid Services (CMS) “consistently overpays MA plans with no demonstrable clinical benefit to patients.”
5 PMPM; The amount of money paid or received on a monthly basis for each individual enrolled in a managed care plan, often referred to as capitation.
6 MA Money Machine; extremely high valuations obtained by start-up insurance companies focused on MA and primary-care physician practices that specialize in contracting with MA plans.
7 Peripheral vascular disease (PVD) refers to any disease or disorder of the circulatory system outside of the heart or brain. (see Coding).
Additional Reading (more later)
HCC Coding, The Risk Adjustment Program, ohsu.edu.
Make the Most of Hierarchical Condition Categories – AAPC Knowledge Center.
Medicare Advantage, Direct Contracting, And The Medicare ‘Money Machine,’ Part 2: Building on the ACO Model, Health Affairs, Richard Gilfillan and Donald M. Berwick.
Part Two Maybe Sunday
https://www.nytimes.com/2023/03/10/business/medicare-advantage-retirement-nyc.html
March 10, 2023
More Retiree Health Plans Move Away From Traditional Medicare
Retirees whose former employers offer health coverage are being shifted to privately run Medicare Advantage, often against their wishes. The change saves millions for employers.
By Mark Miller
https://www.nytimes.com/2023/03/10/business/medicare-advantage-retirement-nyc.html
Bob Bentkowski, a retired New York City firefighter, has a rare, painful disease that caused his kidneys to swell almost to the size of basketballs. He needed a transplant, and in the fall of 2021, he found a donor after waiting for years — but he was unsure whether Medicare would cover his surgery.
New York City has long provided its retired employees with comprehensive health benefits that pay for most of their Medicare costs. But with his transplant approaching, the city, and a coalition of its labor unions, had thrown Mr. Bentkowski a curveball. Aiming to save $600 million annually, they were negotiating to shift 250,000 retirees out of traditional fee-for-service Medicare into a privately operated Medicare Advantage plan.
“I was panicking about what might happen if I moved over to this new plan, since I was only a month away from the surgery,” Mr. Bentkowski said. But after hours on the phone with the insurance company, he was told that it couldn’t give him an answer until he enrolled. “They just give you the runaround — how am I going to join the plan when I don’t know what it will cover?”
Ultimately, Mr. Bentkowski’s surgery was covered under traditional Medicare. The city’s plans for Medicare Advantage became bogged down in litigation and political battles, with the opposition led by a group of New York City retirees who organized to fight not only the city but their own unions. Their battle has continued into this year, with a group representing city workers voting Thursday to approve the latest Advantage proposal.
The fight in New York City is a highly visible example of a nationwide shift in the way some retirees receive health insurance benefits from former employers, both in the public and private sector. It pits the drive to control health care costs against retired workers’ pocketbook and health concerns….