A New Year in 2022 and New Pharmaceutical pricing, a short Explanation
An early attempt as to explaining the drug market. It is a start and I have to program myself to understand what is said. Brief and down to earth with pictures too! Much of this is a C&P with some editing. Much credit to the authors for giving us this opportunity to understand.
Welcoming a New Year with new drug prices, 46brooklyn Research
This year has proven to be little different from past years. In keeping with tradition (for as long as drug pricing benchmarks have been a tradition), brand drug manufacturers big and small took list price increases (as measured by wholesale acquisition cost, or WAC) at the start of the year. Technically most prescription drug price increases occur in either January or July each year. The greatest number take place in January (and thus, January gets all the attention). By our counts, since 2018, more than 60% of all brand drug list price increases occurring throughout the course of each year are in the month of January.
In turn, we await the publication of those price changes so we can keep with our tradition of informing you all about them. They represent an important layer of the broader drug pricing onion. Thankfully, over the years, the work of unlocking the data of drug pricing behavior has become easier for us thanks to our friends at Elsevier and our supremely named Brand Drug List Price Change Box Score visualization. When we ran those numbers at the start of the week, we saw a more muted kick off to the tradition of annual list price changes (more on that later).
List prices are just one part of the drug pricing puzzle. In fact, you can think of list prices as the border pieces of an actual puzzle. They are the starting point that generally frames the broader picture. There many more pieces to the puzzle needed to decipher exactly what’s happening within the frame – or in this case, what’s happening underneath the list price.
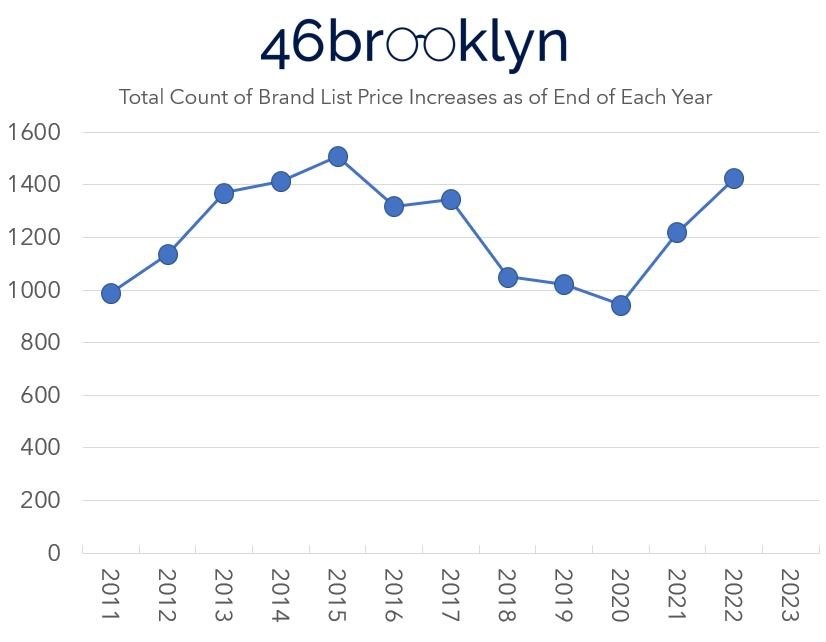
It turns out the nation rung in the New Year on January 1 off with 450 list price increases plus 2 list price decreases giving us 452 changes. The chart below gives us an idea of how many price changes occur each January 1 and going back to 1011. As you can see 2021 was the highest.

A second look back on 2022 before getting too deep (which we won’t this time) into the 2023 price increases reveals 2022 incurred just over 1,400 brand list price increases (1,425 to be exact). That number is higher than the number in 2021 (1,219), and 2020 (994). See below.
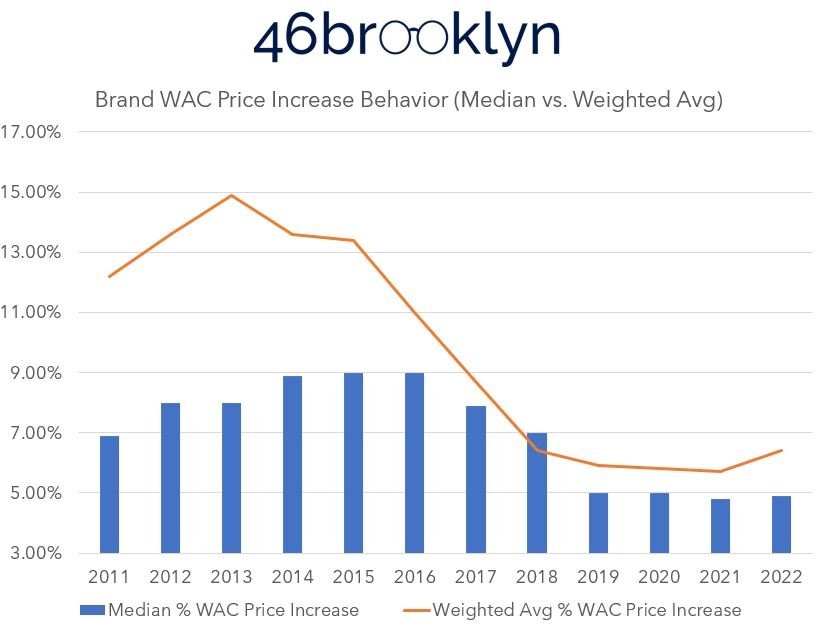
What gets the attention more is the actual price increases themselves. Over time, the weighted average (based on Medicaid utilization data) and the median brand list price increase behavior has, generally, been less extreme. A decade ago, it wasn’t uncommon for the average price increase to be in the low double digits (>10%). As can be seen in Figure 3 (below), the weighted average has declined every year since 2013, except last year (2022). The median has been on a steady decline since 2016.
look at the aggregate Medicare data from Figure 3. It isn’t too hard for us to add an annual Consumer Price Index (CPI) line to that data and get an idea of how the overall drug market might be impacted by a Medicare inflationary rebate (Figure 4). To be more specific, we’re relying upon the Consumer Price Index table from the Federal Reserve Bank of Minneapolis to add the inflation line to Figure 4 below.
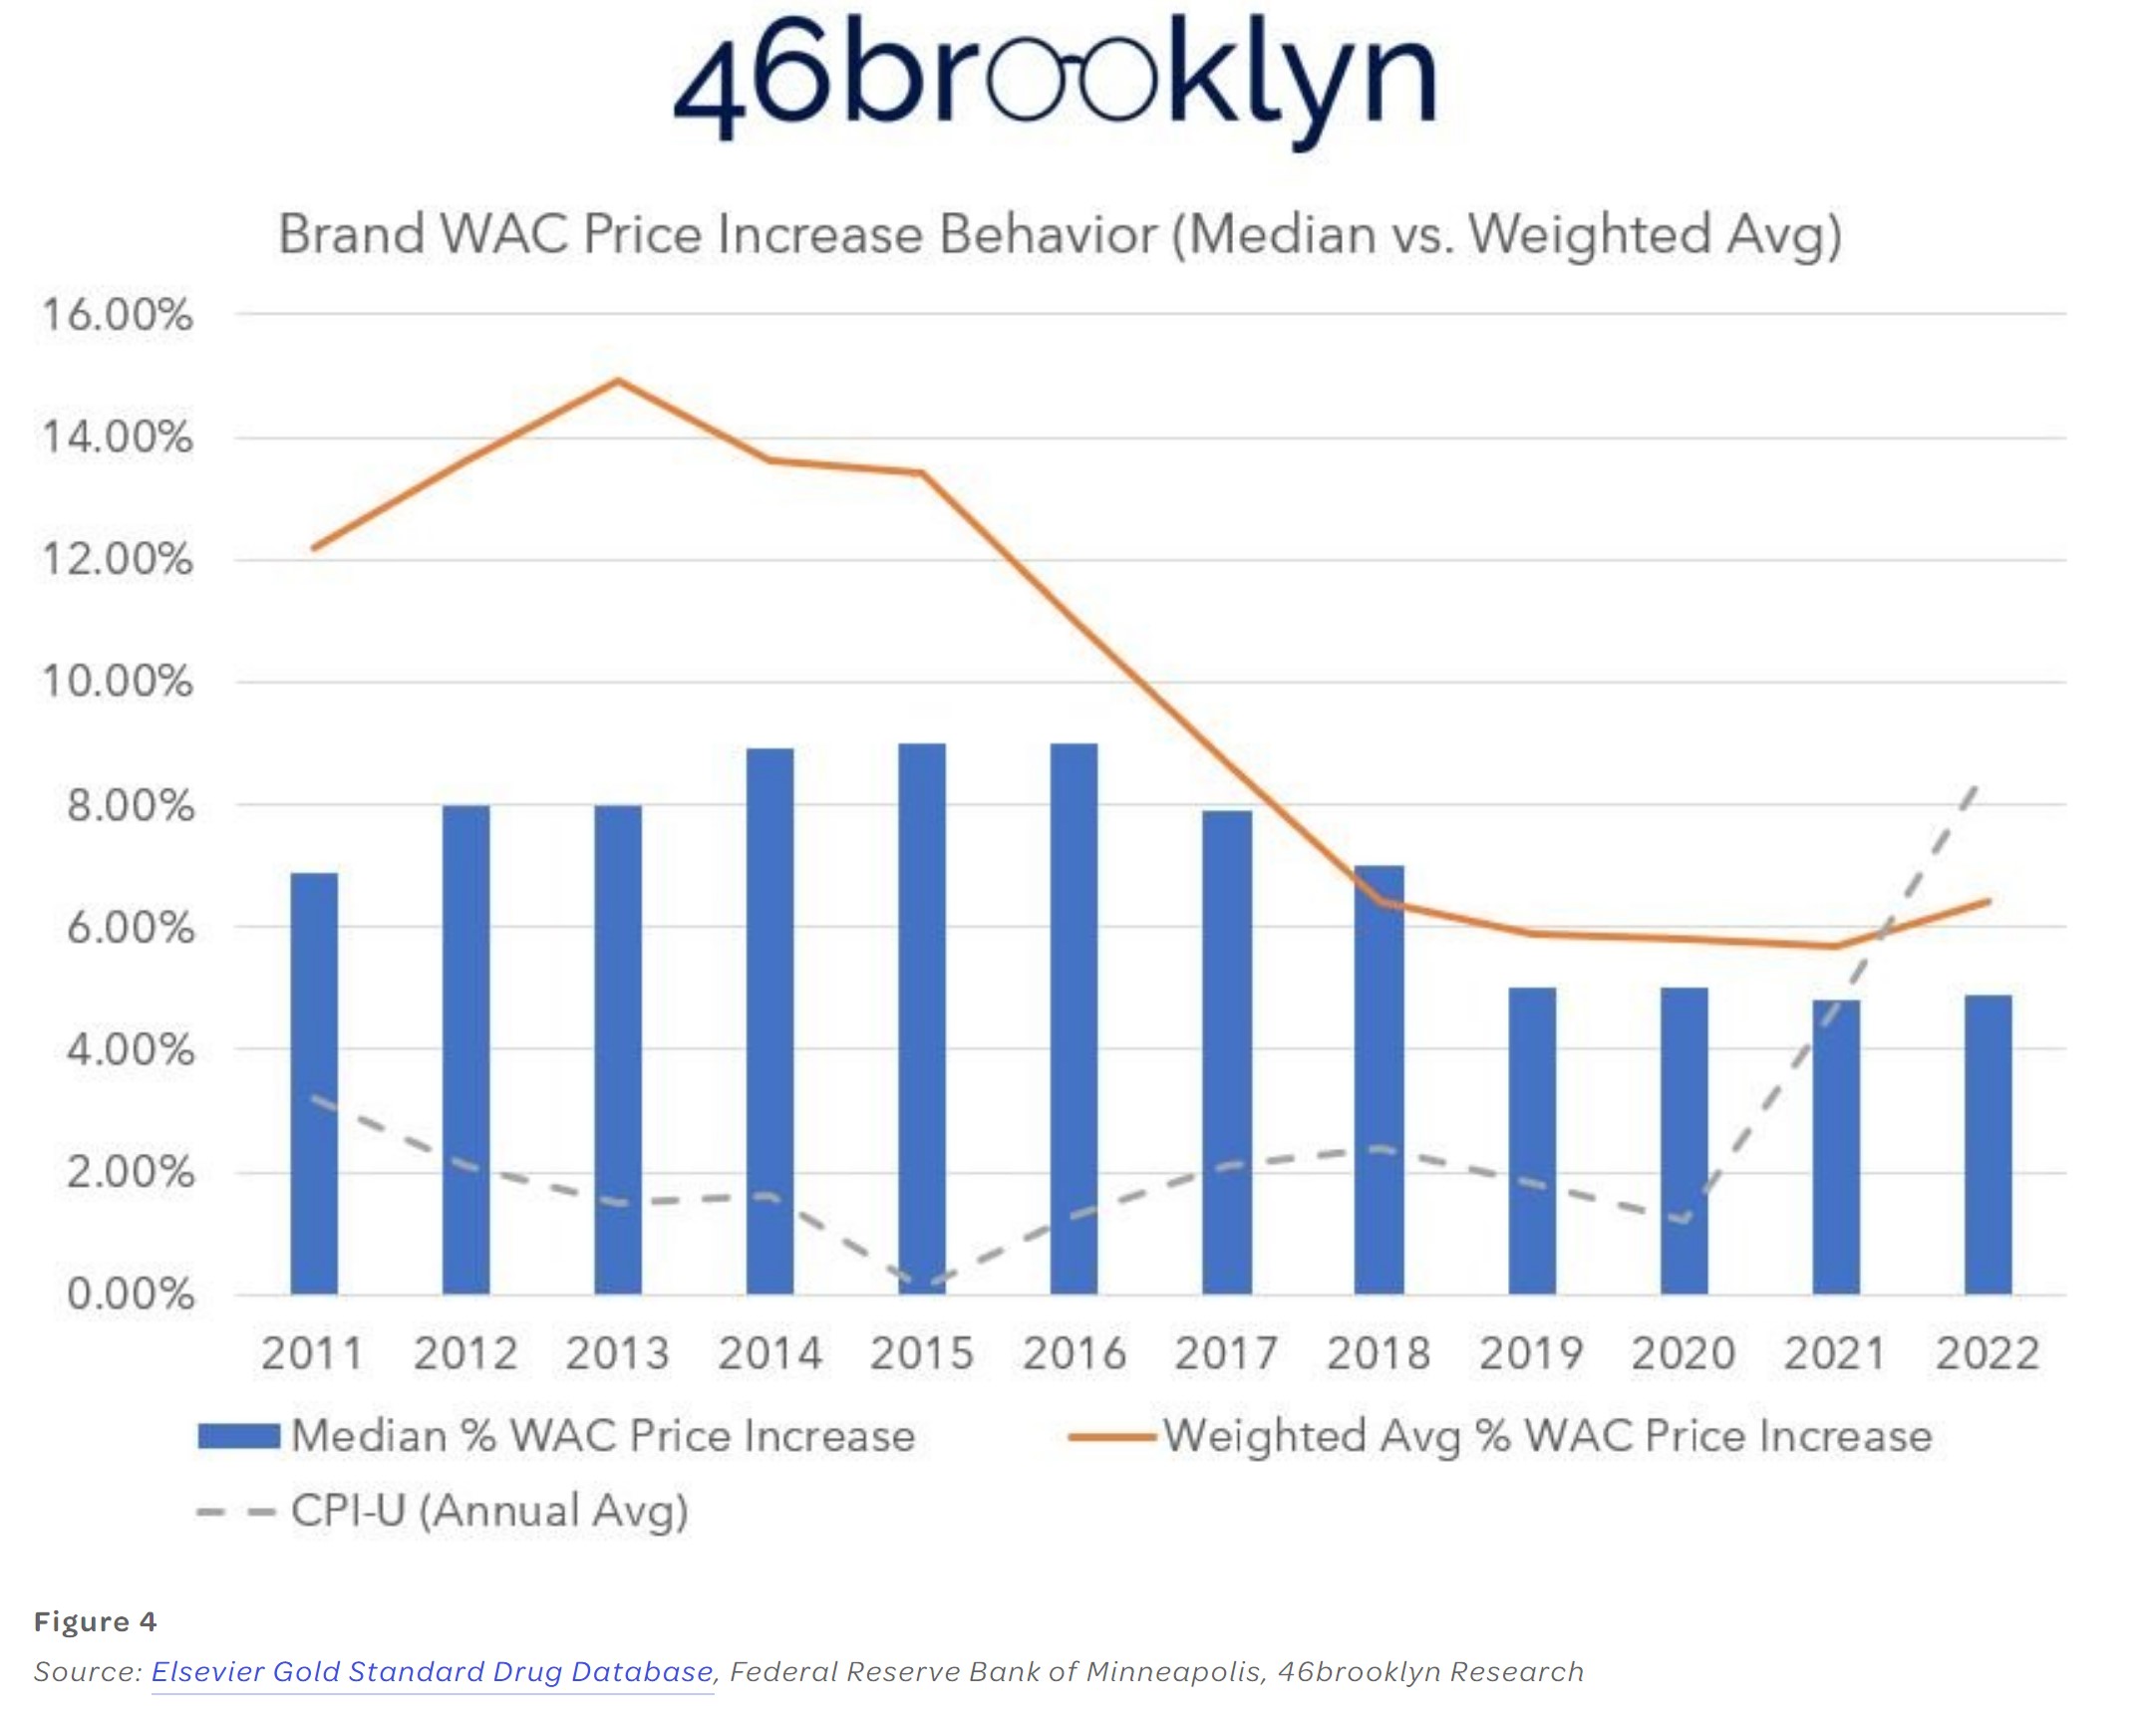
What is seen in Figure 4 is the rationale for an inflationary rebate policy. Over the years, the list price behavior of brand medications have, in the aggregate, consistently been higher than the annualized rate of inflation. As a result, brand drug list prices increasingly seem unaffordable relative to our purchasing power. If, you’re getting a raise every year keeping pace with the rate of inflation, it is not enough. The list prices of these brand products are consistently getting more expensive for you year-over-year as their price increase faster than said inflation.
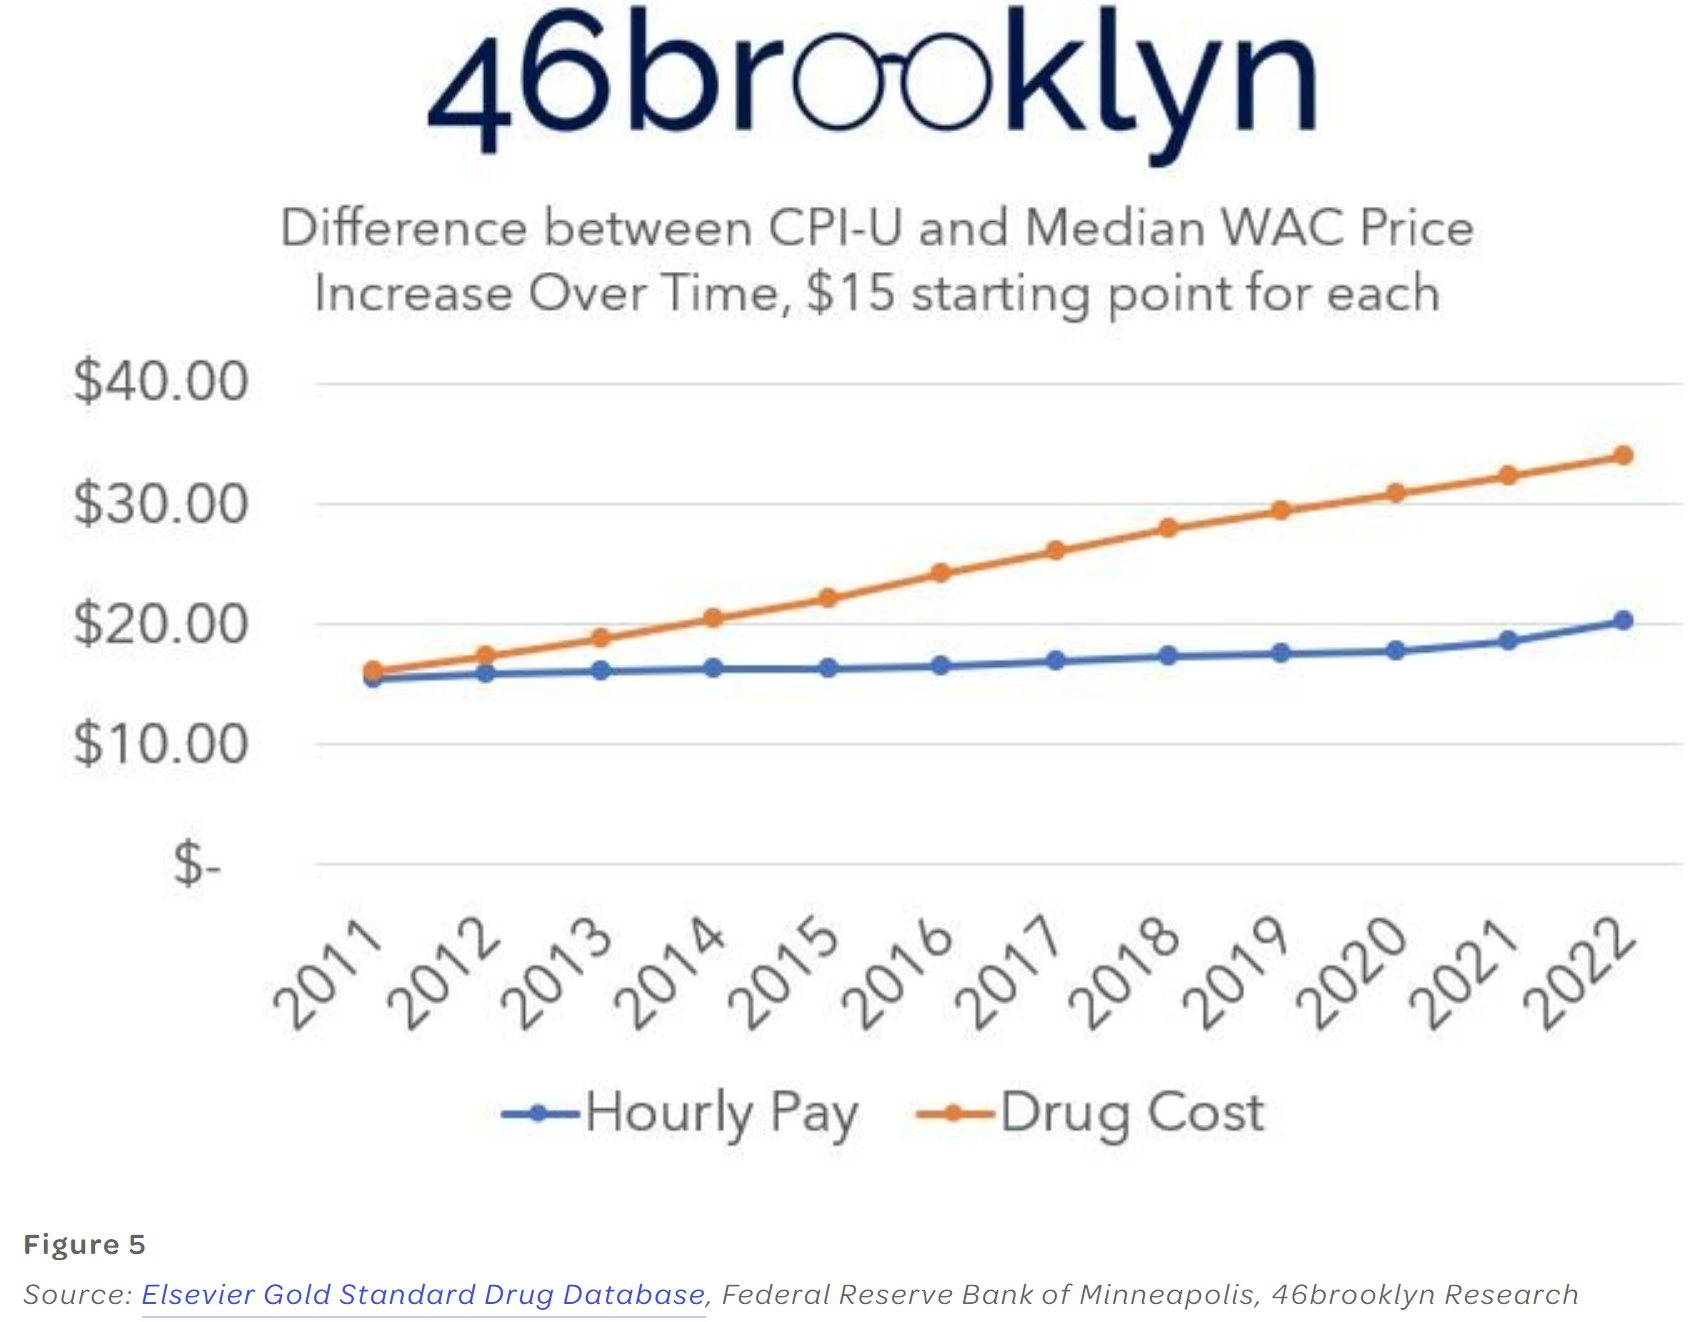
Look at Figure 5. We assume we’re making $15 per hour in the year 2010 and are looking to afford a $15 brand name medication over the years of 2011 to 2022 (we know no brand being $15 in 2011. Also, we want the number to be the same to show how divergent growth was over time. We assume our pay is increasing along with the CPI every year and the brand name medication got more expensive based upon the Median values in Figure 4. As we can see, under this paradigm, the brand medication got less and less affordable each year (except for 2022).
There are two big caveats to this narrative.
First, we again know that there are massive discounts existing and the rebate activity of these drugs is reducing the real net cost of these medications significantly (and maybe resulting in prices below the rate of inflation on a net basis; results will vary depending on the drug).
Second, regardless of the unknown rebates (which we’ve already complained about), 2022 broke the mold. In the aggregate, brand drug price increases did not keep up with inflation (blue slope greater than orange slope in Figure 5). As a result, drug manufacturers effectively took a price decrease on a list price basis alone (rebates be damned).
It is hard to give them too much praise for these list price feats given the previous decade’s worth of past experience. It is true that last year, even without considering what happened with rebates, brand drugs more or less got cheaper (especially in comparison to other things we might buy in the aggregate). While these aggregate views are semi-helpful to understanding why policy moved the direction it did, we wanted to dive in a little deeper into the back end of our dashboard and track the percentage of list price increases for products each year that were above the annual CPI. We wanted to see, outside of the aggregate, which products actually mattered (even over the last year with its higher than usual CPI). Figure 6 tracks the number of brand products whose list price changes in a year were higher than the CPI-U average of that year.
I am going to stop here at this point and pick up with this after tomorrow when I get an eye patch. What I wanted to point out here is how this all works in the aggregate. I still did not get down to the nitty-gritty detail I am sure to find when I examine this more closely. I have my detail mind stirring. Be patient and more to come.
A New Year in 2022 and New Pharmaceutical Pricing: A Short Explanation” is an interesting read on the recent changes in pharmaceutical pricing and their potential impacts on the healthcare industry. It offers a brief overview of the complexities involved in pharmaceutical pricing and the different approaches that governments and policymakers can take to address the issue.
Syed:
I briefly reviewed your site. You appear to be legitimate. Often time we get hackers which is why your comment was stopped. I am just scratching the surface of this interesting and purposely made complex subject. There is more to come from this author and a couple of others who re far more knowledgeable than I am. I will catch up.