Say hello to XBB.1.5: The Red/Blue COVID Death Rate Divide is no more
This commentary by Charles Gaba was up earlier this year. What Charles is doing is issuing a warning about this batch of Covid. People have tossed caution to the wind, not boosting for less than adequate reasons, not practicing safe social practices, and not making up in public crowds.
“Say hello to XBB.1.5: The Red/Blue COVID Death Rate Divide is no more . . . for the moment,” ACA Signups, Charles Gaba
As noted in November:

The graph below shows the partisan COVID death rate gap for every month since the pandemic began in earnest in March 2020. Specifically, it looks at the reddest 20% and bluest 20% of the total U.S. population based on the 2020 Presidential election results at the county level.
The reddest quintile includes roughly 65.1 million people living in counties where Donald Trump received 62.4% or more of the vote in 2020; the bluest quintile includes around 66.8 million living in counties where Trump received less than 31.6%. While the raw numbers aren’t quite equal, both have been adjusted for actual population.
The initial COVID wave in March – May 2020, of course, devastated Blue America, primarily densely populated (and heavily Democratic) New York and New Jersey, while leaving Red America (mostly sparsely populated, rural Republican counties) relatively unscathed.
This situation quickly began to reverse itself only a few months later. Starting in July 2020–the same month the Vanity Fair expose was published, as it happens–the situation had already reversed itself: The reddest fifth of the U.S. was already experiencing a higher COVID death rate than the bluest fifth…and it has stayed that way ever since.
That’s right: While the COVID death rate ratio between the reddest and bluest parts of the country has grown larger and smaller at various points (reaching an all-time high of nearly 4.5:1 during the height of the Delta wave in September 2021), there has never been a single point in time that the bluest quintile has seen a higher death rate than the reddest quintile since July 2020. And this graph only includes official COVID deaths, not the “likely COVID excess deaths” which were never officially recognized as such . . . and which ran over 11 times higher in the reddest fifth of the U.S. than the bluest fifth in 2021.
However, while the lines haven’t reversed themselves again yet, they’ve been getting closer for awhile now–the Red/Blue divide dropped below 2:1 in June 2022 and hasn’t risen above that since. Most notably, in December, it dropped to virtually even (3.87/100K in the reddest quintile vs. 3.79/100K in the bluest quintile…the closest it’s been since May 2021…which, as it happens, is when the original COVID-19 vaccine first became widely available to all U.S. adults nationally.
More concerning is the reason why the red and blue trend lines have intersected. It would be one thing if this was due to the rates in both quintiles dropping (which is what happened from April – May 2021). Unfortunately, this time around, both saw an upswing from November to December 2022, with the death rate in the bluest quintile jumping from 2.6/100K to 3.8/100K, while the reddest quintile inched up just slightly.
So what’s going on to account for this? Well, it sounds like a combination of three things:
- Hardly anyone seems to be wearing masks or socially distancing these days regardless of partisan lean;
- Only 15.1% of the total U.S. population has gotten their updated bivalent booster vaccination dose (up one point from a few weeks ago, anyway); and…
- Say hello to COVID-19 variant XBB.1.5. Via CBS News:
The Centers for Disease Control and Prevention said Friday it is tracking a new variant of concern dubbed XBB.1.5. According to new figures published Friday, it estimates XBB.1.5 makes up 40.5% of new infections across the country.
XBB.1.5’s ascent is overtaking other Omicron variant cousins BQ.1 and BQ.1.1, which had dominated a wave of infections over the fall. Scientists believe its recent growth could be driven by key mutations on top of what was already one of the more immune evasive strains of Omicron to date.
“We’re projecting that it’s going to be the dominant variant in the Northeast region of the country and that it’s going to increase in all regions of the country,” said Dr. Barbara Mahon, director of the CDC’s proposed Coronavirus and Other Respiratory Viruses Division, in an interview with CBS News.
…XBB.1.5’s prevalence is largest in the Northeast, the agency estimates. Most of the earliest cases from XBB.1.5 recorded in global databases through early November were sequenced around New York and Massachusetts.
More than 70% of infections in the regions spanning New Jersey through New England are now from XBB.1.5, the agency is projecting.
New Jersey, New England and the rest of the Northeastern United States is heavily Democratic leaning, so this latest twist in the red/blue trend lines makes perfect sense:
This month, the Northeast has recorded some of the worst COVID-19 hospital admission rates out of any region in the country. In New England, the CDC says new hospitalizations among Americans 70 and older have climbed to the highest levels seen since early February.
Around 13% of Americans are currently living in areas of “high” COVID-19 Community Levels, where the agency currently urges masking. Los Angeles, Miami, and New York City rank among the biggest counties now at these levels.
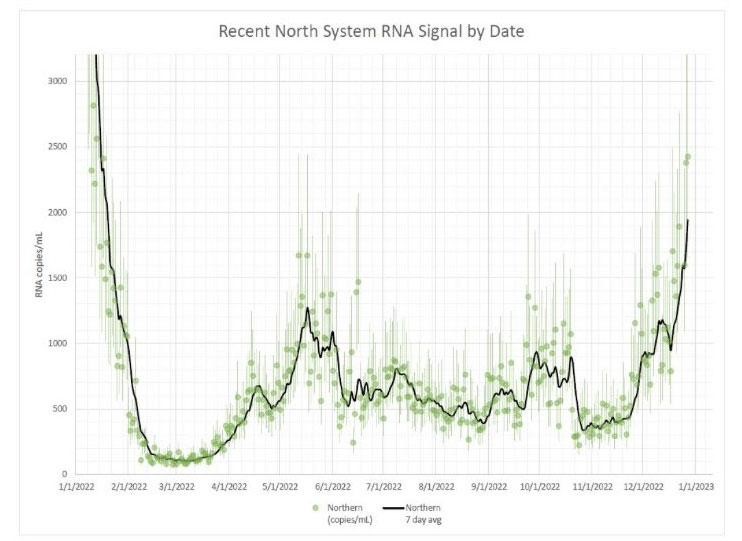
Boston-area wastewater levels are where they were in early Jan and rising fast. MA COVID hospitalizations are at highest since winter Omicron wave, with > 100 COVID deaths last week for the first time in a long time. Little public acknowledgment.
We have become comfortably numb.
Assuming the patterns of the past continue with the spread of XBB.1.5, I’d expect to see a spike in rural/red America a couple of months after it peaks in urban/blue America . . . probably sometime in March or so. The big unknown is how much of a spike either one will be this time around.
In short:
Get vaccinated, get your bivalent booster, and still wear a mask when attending crowded indoors public events if possible.

“December Update: COVID Death Rates by Partisan Lean & Vaccination Rate,” Angry Bear, angry bear blog
“September Update: COVID Death Rates By Partisan Lean & Vaccination Rate,” Angry Bear, angry bear blog
My understanding is XBB1.5 is more transmissible but not more virulent than prior omicron derived variants, which in turn are less virulent than delta was. A lot of indications are that repeated exposures to COVID weakens the immune system on a long-term basis due to repeated cycling and thereby exhausting t-cells. There are some indications that the body’s reaction to mRNA vaccines cycles the t-cells in much the same way, which would be unfortunate. You gain protection against severe disease for some months, but also contribute to wearing down long-term immune responses to COVID and other pathogens. Mask up and limit exposure to social gatherings and improve ventilation where possible. How much data is available on Novovax? Possibly might have advantages over mRNA.
A lot of indications are that repeated exposures to COVID weakens the immune system on a long-term basis due to repeated cycling and thereby exhausting t-cells. There are some indications that the body’s reaction to mRNA vaccines cycles the t-cells in much the same way, which would be unfortunate….
[ This should form a very important research direction and research that could easily include experience in countries broadly using alternate vaccines. However, I do not even find interest in looking, say, at Cuba which appears to have had dramatic success with domestically made alternate vaccines. Why is the apparent Cuban success not compared with the seeming problems in Puerto Rico or definite problems in Florida? ]
The only papers I can find on COVID and T cell exhaustion involve patients with severe cases. It’s something that often happens to people with chronic viral infections. There’s no evidence that vaccines or even multiple mild cases exhaust T cells. It may be, as it is so often in medicine, that the does makes the poison.
https://www.worldometers.info/coronavirus/
January 12, 2023
Coronavirus
Florida
Cases ( 7,393,406)
Deaths ( 84,170)
Deaths per million ( 3,919)
Cuba
Cases ( 1,112,230)
Deaths ( 8,530)
Deaths per million ( 754)
“There are some indications that the body’s reaction to mRNA vaccines cycles the t-cells in much the same way, which would be unfortunate….”
This assertion “must” be referenced. I know of no such research finding, and a published research reference is “essential” when casting doubt on the value of a vaccine.
Please set down a proper reference.
“A lot of indications are that repeated exposures to COVID weakens the immune system on a long-term basis due to repeated cycling and thereby exhausting t-cells. There are some indications that the body’s reaction to mRNA vaccines cycles the t-cells in much the same way, which would be unfortunate….”
Where is the published research to both assertions? The first assertion if correct does not mean the second assertion is correct. Please reference.
https://www.nytimes.com/2023/01/13/health/covid-boosters-stroke.html
January 13, 2023
No Increased Stroke Risk Linked to Pfizer’s Covid Boosters, Federal Officials Say
An uptick hinted at in surveillance data was a mirage, the officials said.
By Apoorva Mandavilli
Fears that the Covid booster shots made by Pfizer-BioNTech may increase the risk of strokes in people aged 65 and older were not borne out by an intensive scientific investigation, federal officials said on Friday.
“It is very unlikely” that the risk is real, the officials said. They urged Americans 6 months and older to continue getting booster shots. Federal officials decided to disclose the concern and the results of their investigation despite worries that the revelation might fuel anti-vaccine sentiment.
“We believe it is important to share this information with the public,” a joint statement from the Centers for Disease Control and Prevention and the Food and Drug Administration said….
Good Information
https://www.worldometers.info/coronavirus/
January 12, 2023
Coronavirus
United States
Cases ( 103,426,740)
Deaths ( 1,124,399)
Deaths per million ( 3,358)
there was a long article at CNN earlier this week on how early Moderna studies that showed those who got the new bivalent booster got Covid more often were buried…
the booster was approved cause it worked in test tubes, not in the real world..
like i said it’s a long article, so go read it for yourselves…
That’s routine practice with the flu vaccine and has been for decades. So far, large scale studies show the new booster working well.
The experts at the CDC and FDA seemed unconcerned with that case count, so I followed the link to the pre-print mentioned to figure out whether they were just idiots or the paper didn’t really add all that much to the discussion.
The first thing I noticed is that the studies were small, N=814. There were 16 COVID cases in all, 6 with symptoms, no hospitalizations, no deaths. That’s a really small study with a minuscule effect size. Odds are, they are just picking up noise. The paper plays up the stronger immune system response that the bivalent booster invokes for a longer period of time than the earlier vaccine. This is a proxy result, but immune response has been shown to be a useful proxy result.
Judging from an Israeli paper I recently read, the bivalent vaccine works at least as well as the previous vaccine. The Israelis haven’t been doing a side by side comparison, so that’s the news.
The bivalent vaccine is at least as good as the older vaccine, and it evokes a strong response for a longer period. Sounds good to me.