October CPI reports total inflation increases at a 3.5% annual rate
October CPI report: total inflation increasing at 3.5% annual rate, core inflation minus shelter increasing at 2.8% annual rate in the past 4 months
– by New Deal democrat
For a full year now I’ve been hammering the fact that the official CPI measure of housing inflation, “owners’ equivalent rent,” seriously lags actual house prices as measured by the most popular housing indexes. I said then, and I have reiterated almost every month since, that because of this serious lag, OER was going to rise probably to 7.5% YoY or more, and drag core CPI along with it. That remained evident in this morning’s October CPI report.
Here are the headlines:
Total CPI +0.4% +7.8% YoY (-0.4% YoY decrease from last month, and down -1.2% from June’s high of +9.0%)
“Core” CPI +0.3% +6.3% YoY (-0.4% decrease from last month’s 40 year high)
The below graph shows the monthly change in total (blue) and core (red) inflation since January 2021:

It’s clear that there has been a significant deceleration in the past 4 months.
Owners’ equivalent rent rose +0.6% for the month, making a new +6.9% all time high YoY (exactly as I started forecasting a full year ago) compared with the FHFA purchase only house price index (black, /2 for scale):

Here’s what core inflation excluding OER looks like m/m (it was unchanged!):
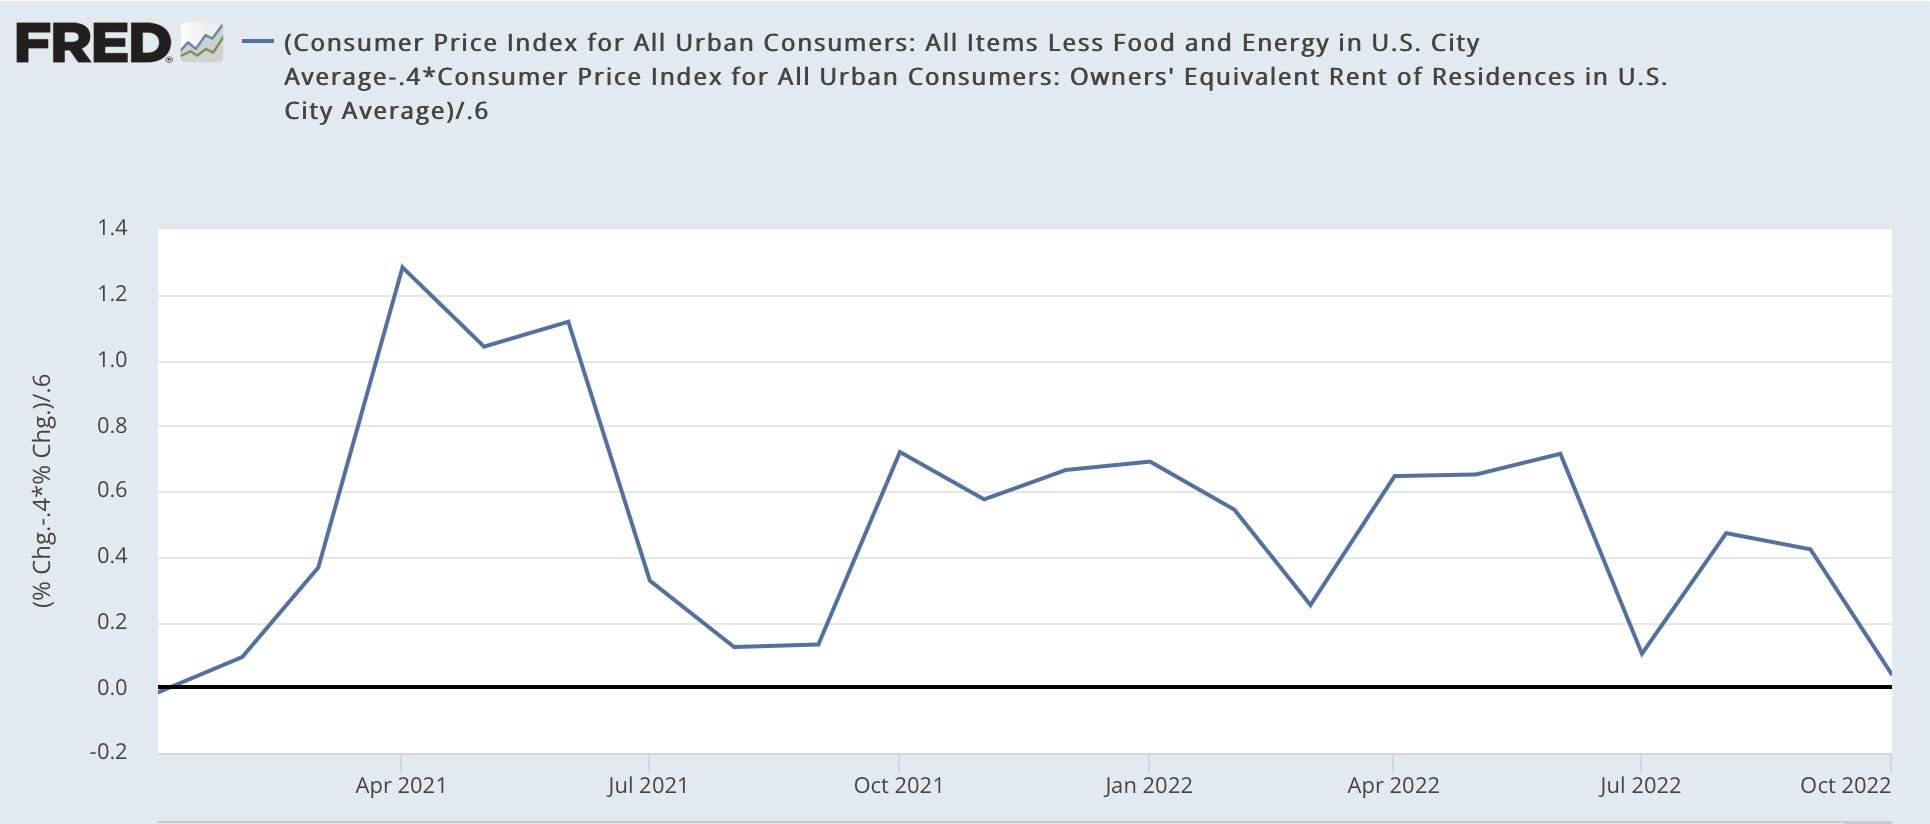
And YoY (up 5.9%):

In other words, in the last 4 months, since gas prices peaked, total inflation has increased at a rate of 3.6% YoY. Core inflation minus OER has increased at only a 2.8% annual rate.
Here are some other highlights of the report.
Energy prices increased 1.8% for the month:

Used vehicles: -2.4% +2.0% YoY (down from +41.2% in February
New vehicles: +0.5% +8.4% YoY (down from +13.2% in April)

The YoY sharp deceleration in used car prices doesn’t mean they’re cheap: they’re still almost 50% more expensive than they were when the pandemic lockdowns ended. But they are about -5% down from their January peak. New vehicles are still very problematic:

In sum, high inflation at this point is primarily a function of housing. And while actual house prices have turned down slightly in the past several months, and are sharply decelerating YoY (but still up 12% vs. their 20% YoY high), the fictitious and lagging measure of housing – owners equivalent rent – that is used by the Census Bureau continues to misrepresent the true picture.
To repeat how I closed this report last month, in hiking rates, the Fed is chasing a phantom menace.
“August CPI: sharp gains in housing and new cars offset declines in used cars and gas,” Angry Bear, angry bear blog.
well, I even looked up owner’s equivalent rent. still don’t really understand what it means, how it affects inflation (not how it changes the numbers, but what are the actual real world forces).
i will note that rents these days are way too high because corporate landlords have the power to raise them obscenely..unless you want to live on the street. can’t see where raising interest rates is going to help that. of course I really don’t understand the mechanism of how interest rates control inflation…at least they didn’t seem to do much good during the Volker recession.
Wolf Richter picked a different part of the CPI report to focus on, and arrived at a different conclusion:
Services Inflation Spiked to Second Highest in 4 Decades, Would Have Spiked to Highest, If Not Slowed by Biggest-Ever Mega-Adjustment of Health Insurance CPI
he notes that the October CPI was dragged down by a 4.0% decrease in health insurance costs..