Decreasing Labor Force Since Pandemic Due to Ageing
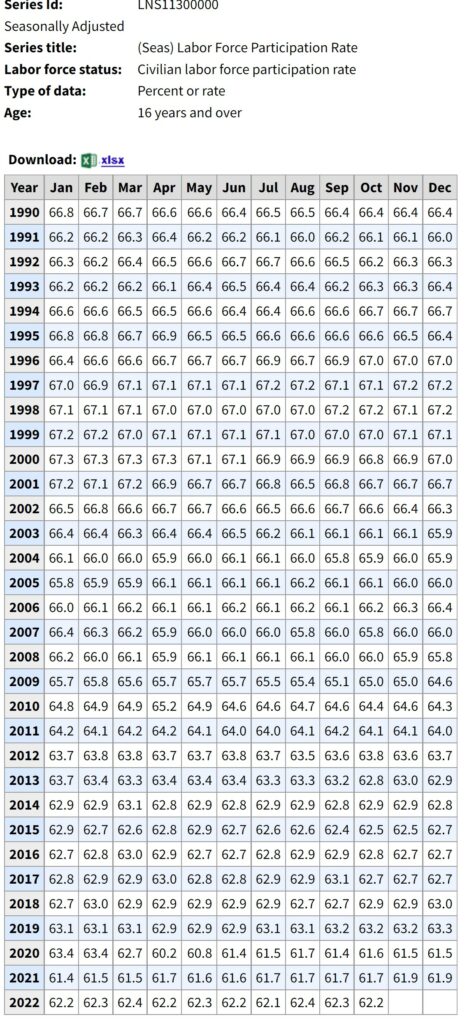
Have not done this in a while, maybe a long while. It was late 1996 and Participation Rate was up at 67%. It stayed up there till 2001 and Greenspan began a gradual decrease from in the Fed Rate from 6.0% down to 1.75%. I believe we had a small recession back then. Greenspan was trying to avoid it from becoming worse. 2001 was the last time the country saw Participation Rate at 67%.. The country has not seen a 67% Participation Rate since 2001 (redundant alert).
Instead, you can see the Seasonally Adjusted Participation Rate decreasing slowly to 2008 and then a little faster
decrease afterwards recently. Much of this is due to baby-boomers retiring. Politicians were using Unemployment Rate (U3) to make statements either criticizing the incumbent or in support of the incumbent. If you wanted to understand unemployment then, one needed to look at Participation Rate and recalculate U3. Till it became a trend . . .
The reason for the Seasonally Adjusted Civilian Labor Force Participation Rate is to avoid discussions on what PR is or was since 1980. Its there . . .
“After rising steadily for more than three decades, the overall labor force participation rate peaked at 67.3 percent in early 2000 and subsequently fell to 62.7 percent by mid-2016. In recent years, the movement of the baby-boom population into age groups that generally exhibit low labor force participation has placed downward pressure on the overall participation rate.” Labor force participation: what has happened since the peak? Monthly Labor Review: U.S. Bureau of Labor Statistics (bls.gov).
February 2020, the country was at 63.4%. It started to drop during the pandemic. Much of the country’s labor stayed home to avoid Covid.
So what is going on now?
The Participation Rate has climbed again as people returned to work. However, PR has stayed ~ 1% lower at 62.2% in October 2022. It may not return to 63.4% as much of this population is ageing out.
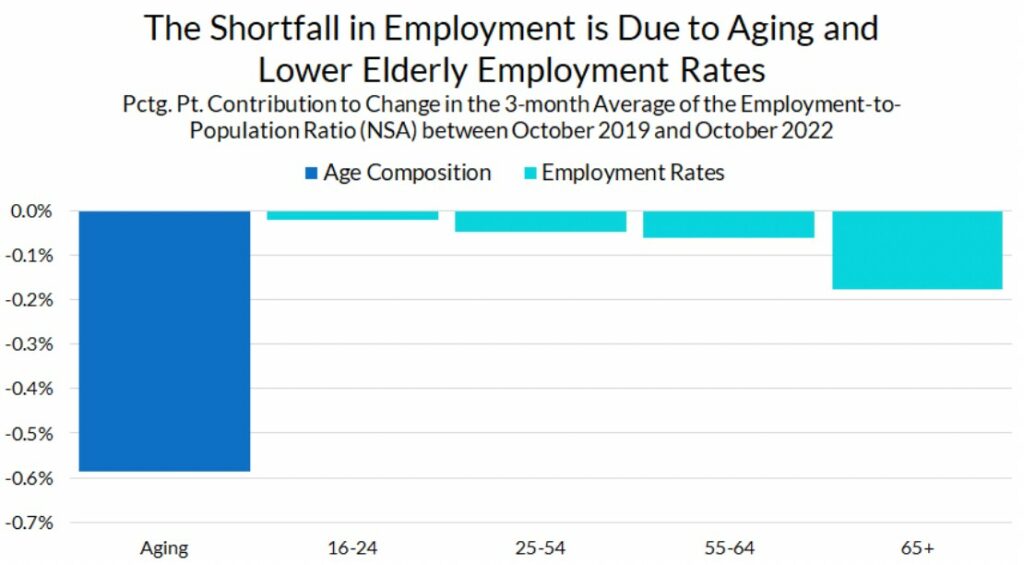
The next chart is drawn from “Who is Driving the Labor Shortage? Part-time Over-70 Workers,” (employamerica.org), Preston Mui.
Chart Source: Bureau of Labor Statistics, Author’s Calculations. The employment effects for narrow age bands are aggregated for this chart.
“The decline in the overall employment rate was 0.89pp. Of this decline, the aging effect accounts for 0.58pp, about two-thirds of the total decline. The “failure” of employment to rebound to pre-pandemic levels is not primarily explained by some decreased “willingness to work.” But rather, it is the steady aging of the population.
The remainder of the decline in employment, 0.30pp, is accounted for by the employment effect. This employment effect is in turn mostly explained by a decline in the employment rate of the 65+ population. The decline in the employment of workers between the ages of 55 and 64 (workers who would potentially be taking “early retirement”) accounts for only a minimal part of the overall decline.”
Redundant alert: The “failure” of employment to rebound to pre-pandemic levels is not primarily explained by decreased “willingness to work.” Rather, it is the steady aging of the population giving a better explanation. This is the same argument Republicans were using in 2010. To my knowledge (and if you have other detail), the economy was weaker then. Well-paying jobs were still not plentiful. People took retirement then too. As you can see by the Participation Rate, we never hit 67% again. There is a gradual decrease from 66% since 2008.
This decrease may also pose a dilemma for Social Security as fewer workers are paying into it. latest SSA projections indicate there will be 2.1 workers per Social Security beneficiary in 2040, down from 3.7 in 1970. Twenty twenty-one is the first year since 1937 the U.S. population grew by fewer than one million people. The lowest numeric growth since at least 1900 (Census Bureau began annual population estimates).
The link to another post carrying detail and from may explain further.
“Immigration, Population, Replacement, Politics and the Economy,” Angry Bear, angrybearblog.com.


You understand that increased immigration would alleviate labor shortages, but Republicans want to eliminate social security to force grandma and grandpa back to work— and I am pessimistic that the superstitious, ambitious and ignorant are going to give them a chance to do so. Trump last night called for the summary execution of alleged drug dealers— this is a run up to genocide IMHO.
It might be more accurate to say that the participation rate has declined simply because Baby Boomers are retiring or expiring. The biggest demographic bubble in US history is aging out.
Covid didn’t help, or did it? Mainly, we just got old.
Actually, Millennials have been the largest living adult generation since 2019.
Labor force participation rates have decreased in all age brackets since a decade ago except for older Americans. Something else is going on besides an “ageing population” narrative that is too easy and lazy to make. COVID, addiction rates, skills gap for the modern economy, different lifestyle choices, and decisions due to inflation are all guesses but no one has really been able to nail why the LFPR is so low when the number of job openings is so great. If you do, then you can probably make a decent income consulting a lot of organizations about it.
Considering the excess death numbers can be triple of the actual count, I’m confident Covid death have contributed to the “labor shortage” far more than is being understood. But, the excess death numbers are usually 3 to 5 years after the event.
I know it fits the Republican mind set that laziness is always the cause but that really makes no sense when you think about how the economy is moving along.
Working smarter, not harder maybe?
Could be all those robots & AI are boosting productivuty.
six weeks ago, Brookings was out with a paper that said we’re missing up to 4,000,000 workers due to Long Covid…
https://www.brookings.edu/research/new-data-shows-long-covid-is-keeping-as-many-as-4-million-people-out-of-work/
i know of three personally…
An ageing population would be a good explanation, except we have access to data that refutes it. Labor force participation rates for multiple key age groups under 65 have decreased significantly. In fact, the only age demographic groups that increased their LFPR are older Americans.
The 25-34 year old age group (45.35 mil civilian noninstitutional Americans today) saw its LFPR decrease from 84.0% in 2001 to 81.1% this year. The 20-24 year old demograpahic (20.8 mil civilian noninstitutional Americans today) went from 77.1% to 67.3%. The 35-44 group (42.6 mil civilian noninstitutional Americans today), which is indicative a where most people solidify their careers, declined from 84.6% in 2001 to 81.8% last year.
However, Americans in pension age demographics have increased their LFPR. The 65 to 74 year old demographic (16.0 mil civilian noninstitutional Americans today) went from an LFPR of 19.7% in 2001 to 31.9% in 2022. And those over 75 went from 5.2% to 10.5%. In fact, increased living costs and negative effects to their retirement savings and pensions have caused millions of our older citizens to return to the workforce, causing an actual reduction in the nation’s retired population. Additionally, the percent of workers who were retired 4 years ago (and in our case, they retired before the pandemic) has reached an all-time high, more than tripling previous highs.
Inflation can also help explain the decreased labor participation rates in younger demographics despite the incredible number of job openings. Why rush a return to work when you can wait and probably obtain a higher starting wage? Why not search for the ideal job as whatever you save will be swiped by inflation?
Easy narratives are easy to catch if we decide to take the time and look INTO the data further, instead of relying on headlines to dictate our takes on what is underlying the changing trends.
Sources:
https://www.bls.gov/opub/mlr/2013/article/labor-force-projections-to-2022-the-labor-force-participation-rate-continues-to-fall.htm
https://www.bls.gov/emp/tables/civilian-labor-force-participation-rate.htm