Assessment: President Biden’s First Year, Successful? You decide.
As we hear how poorly the economy has been doing, I thought I might review Biden’s first year in office using six graphs from CEPR. I only wish the economy was this poor in 2008 when I forced to seek jobs out of state and work out of state for four years. I was good on making the swoop home to my wife the same as I did coming home from overseas duty.
“Assessing the First Year of Biden, in Graphs” is what CEPR is calling its collection of articles and graphs. A collection depicting how quickly the economy rebounded under Biden’s presidency. Despite Republican opposition and the pandemic, the stimulus packages put in place under his leadership with the support of a majority of Congress was largely successful. Much more successful than what was experienced after the 2008 Wall Street take down of Main Street with their malfeasance.
The country has experienced a faster than expected recovery and growth rebounding to a pre-pandemic economy. A large percentage of the labor force, “including most working-class people, have higher wages and overall incomes.” Coming even after taking inflation into account and before the pandemic.
Six CEPR Charts illustrating how quickly the United States rebounded in 2021
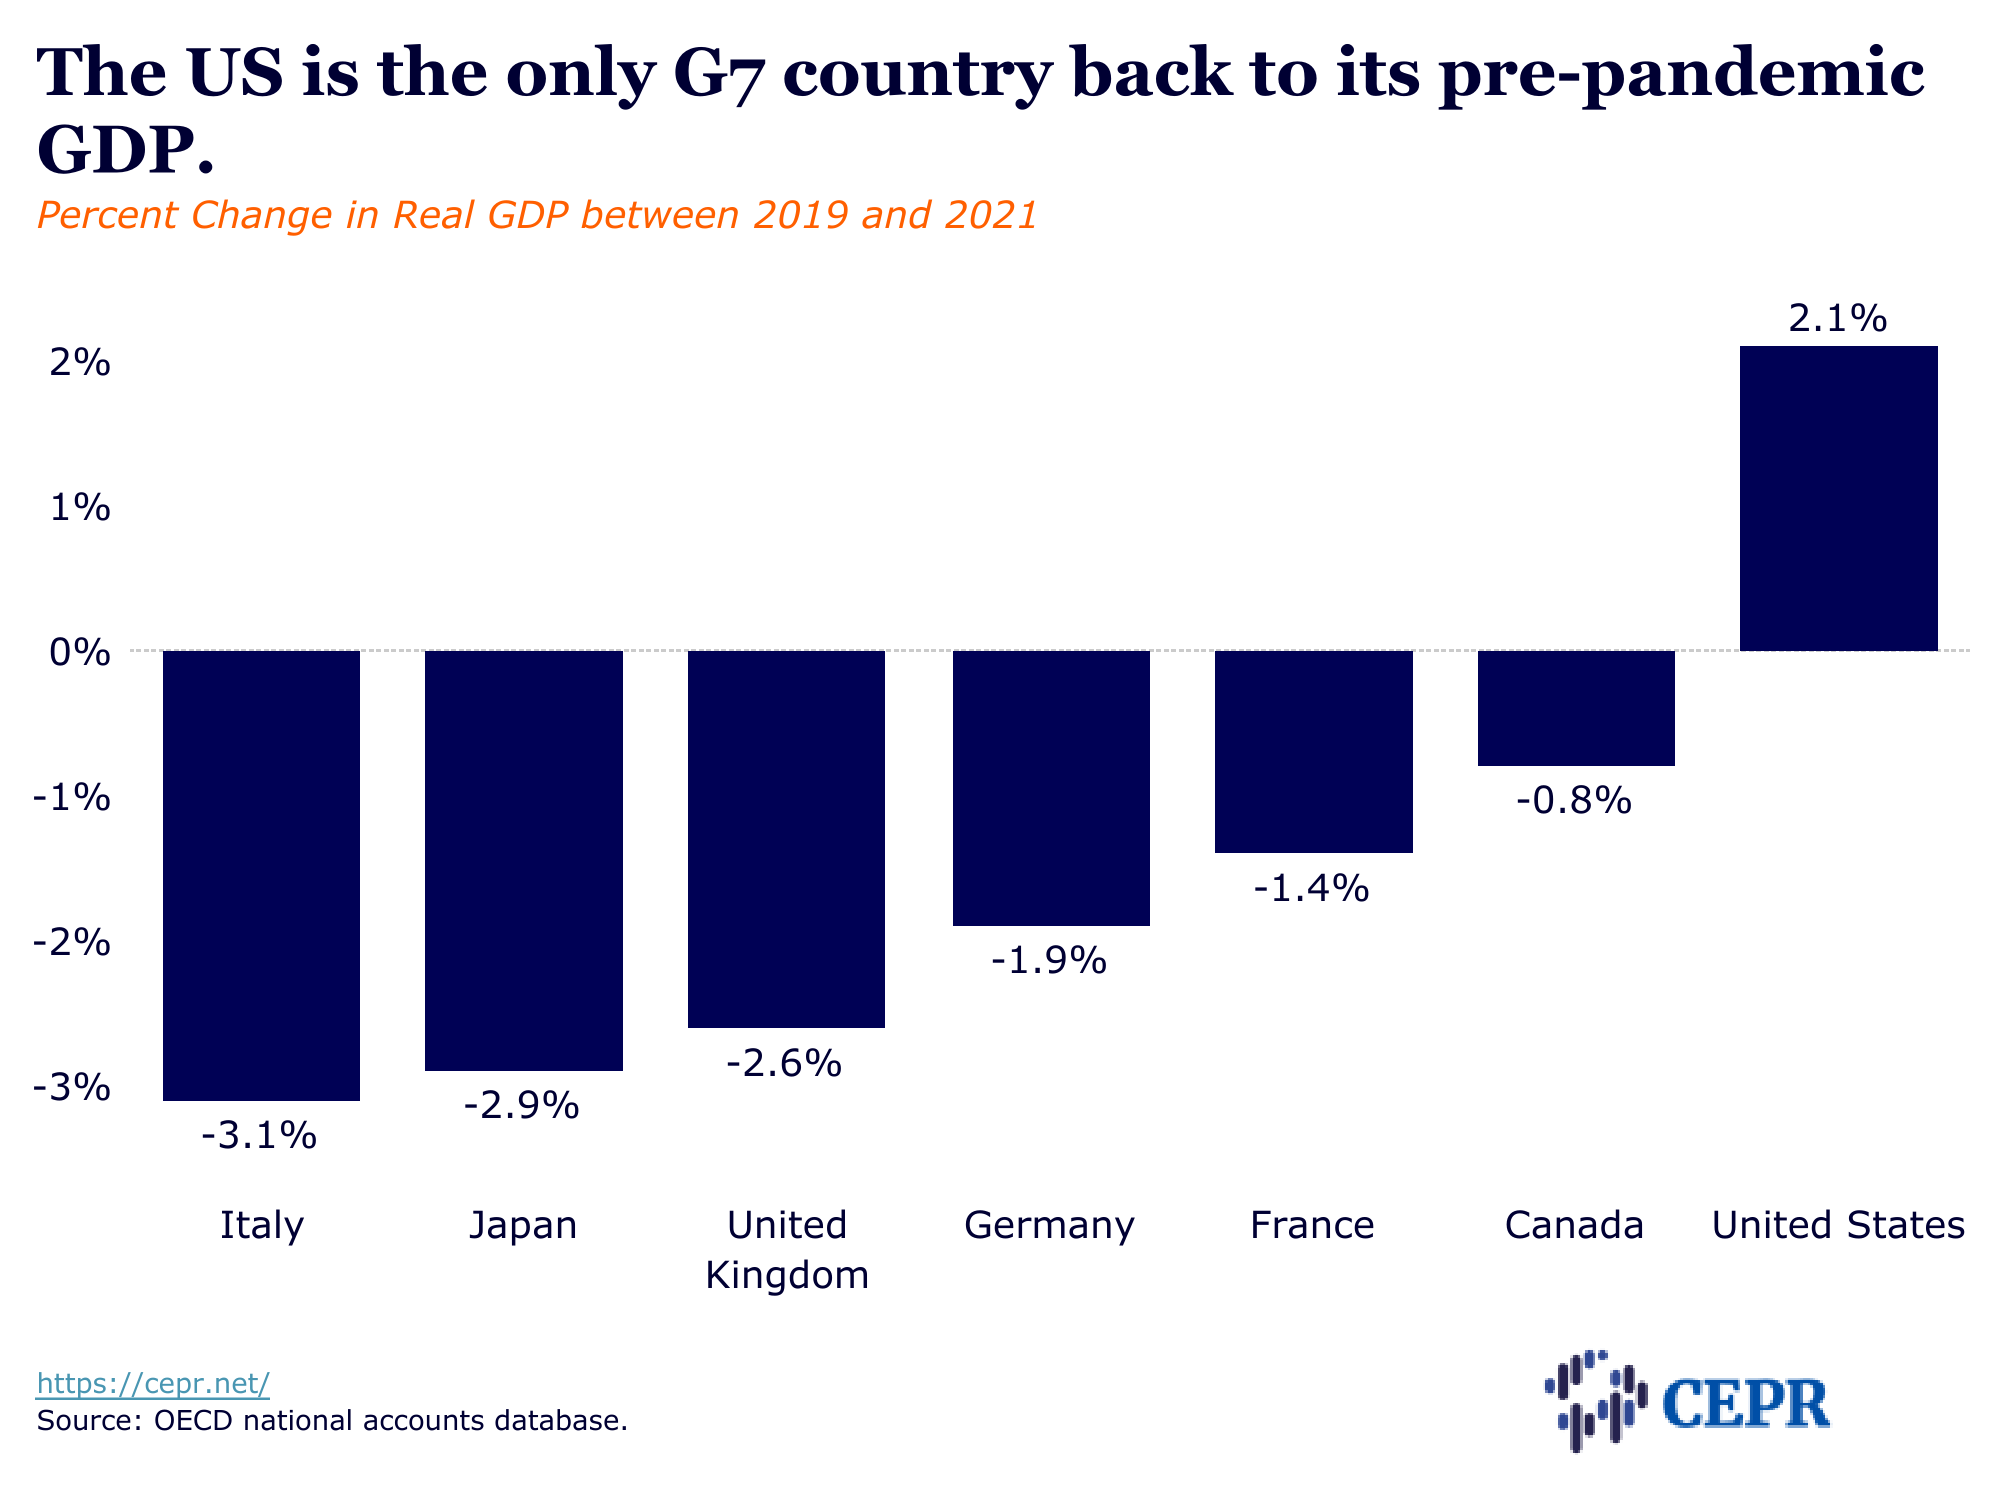
- Biden’s passage of the American Recovery Act with the aid of Democrats, grew the US economy by 5.5 percent. starting in fourth quarter 2020 to the fourth quarter 2021. The US was The US was the only wealthy country that is back to return to its pre-pandemic growth path. Real GDP was 2.1 percent higher in 2021 than in 2019
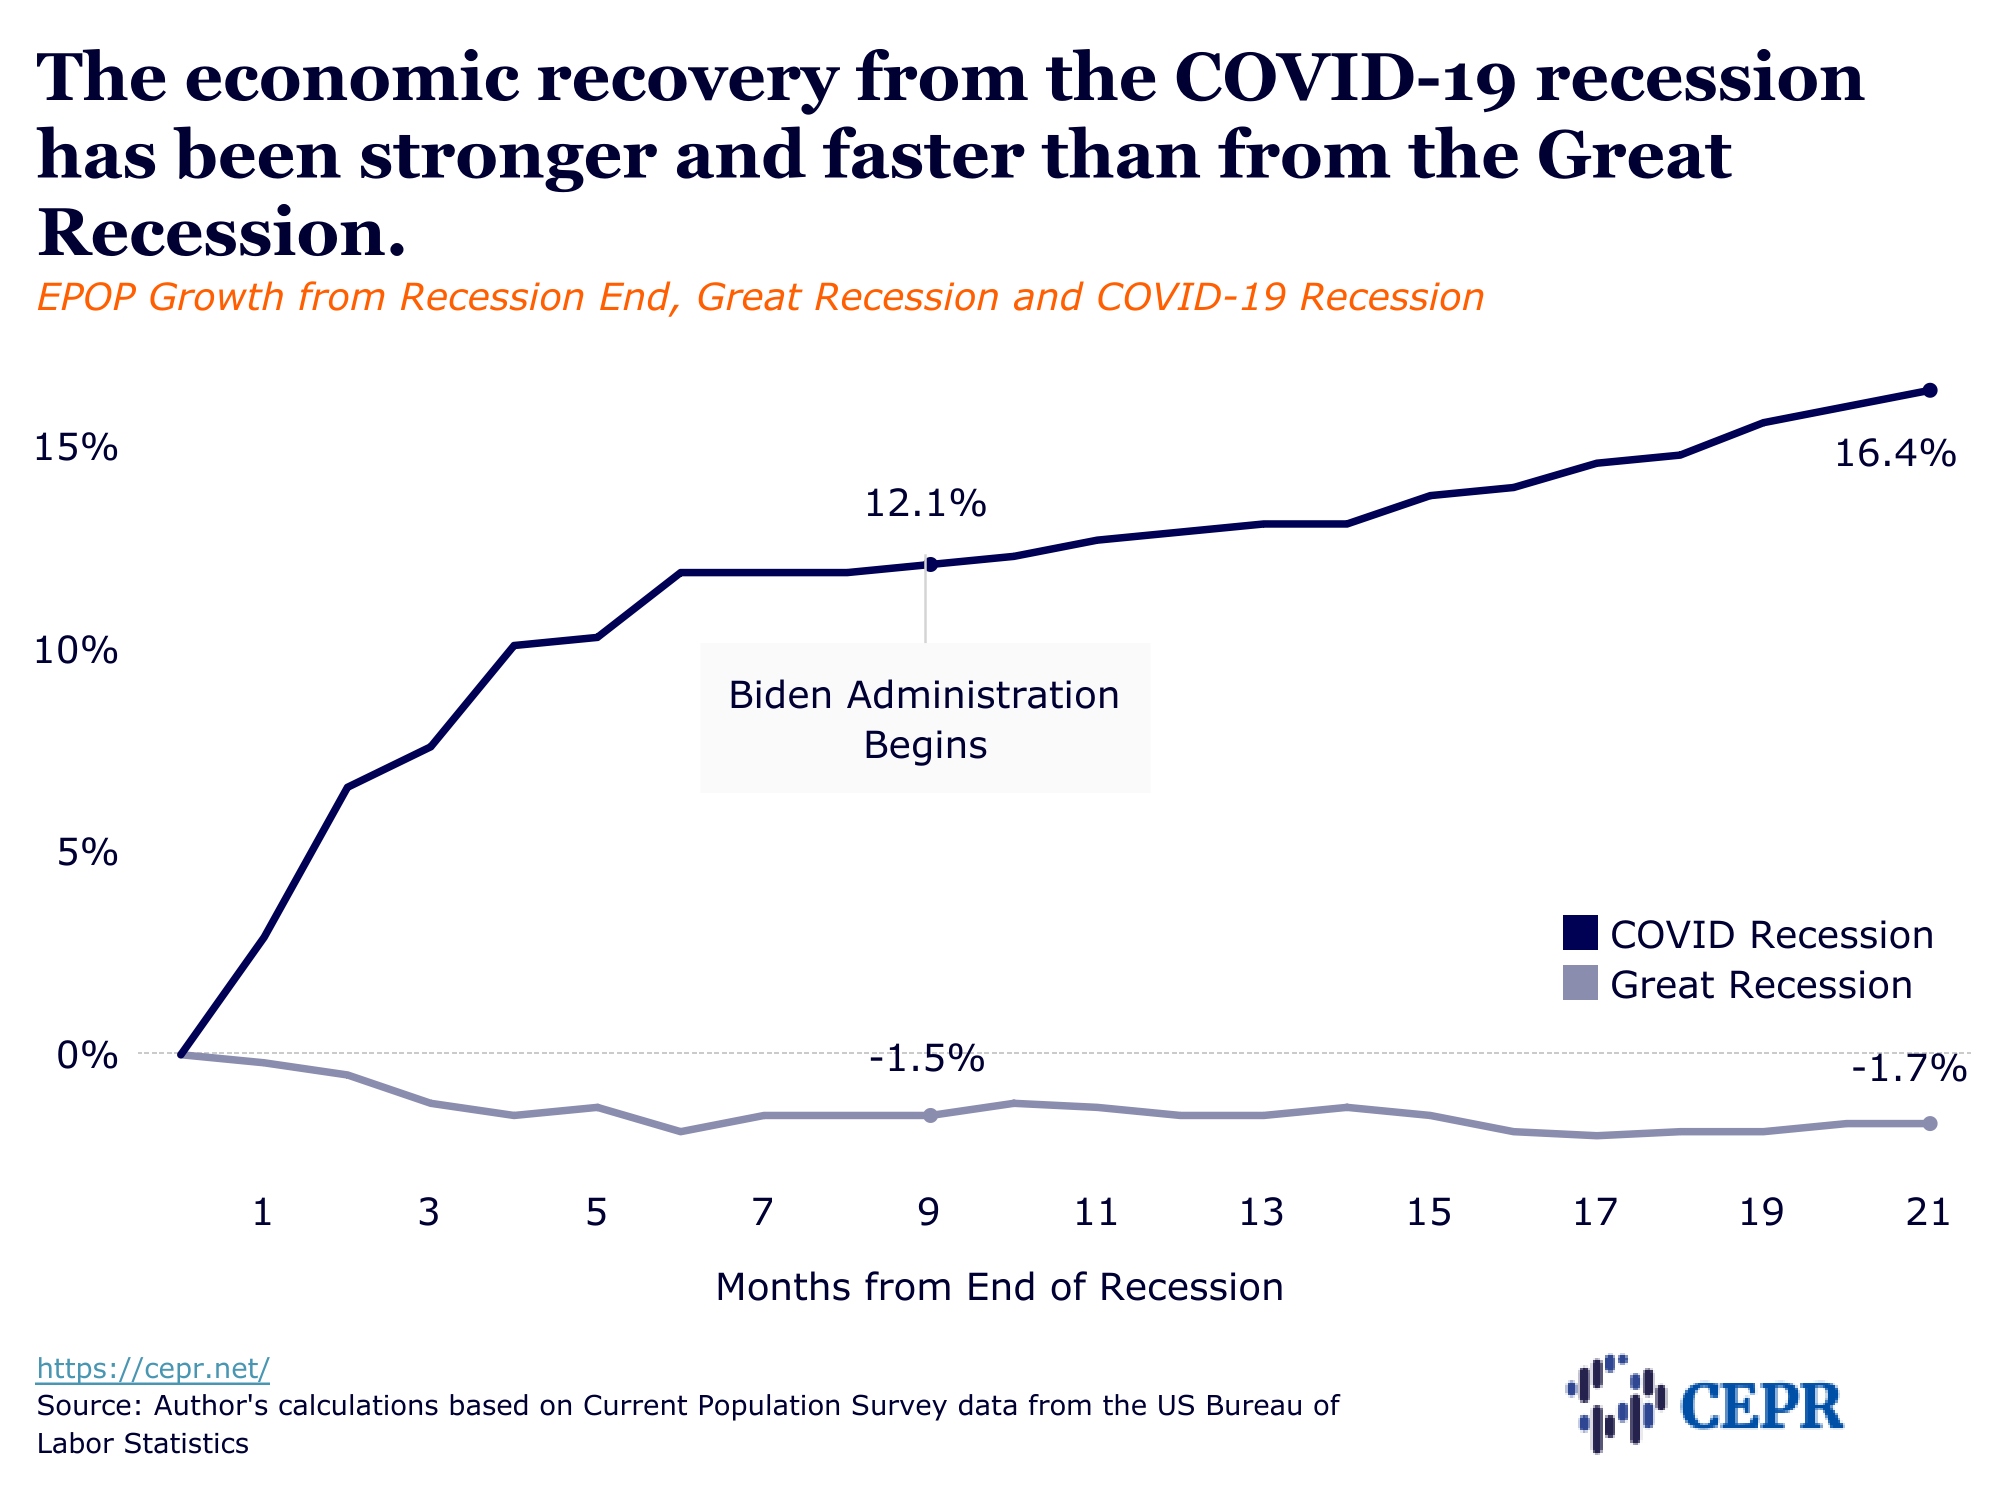
- Growth in employment while not as fast as immediately after the official end of the COVID-19 recession, it has continued over President Biden’s first year. Rate of Growth now (February 25, 2022) is significantly stronger than it was in a similar phase after the Great Recession.
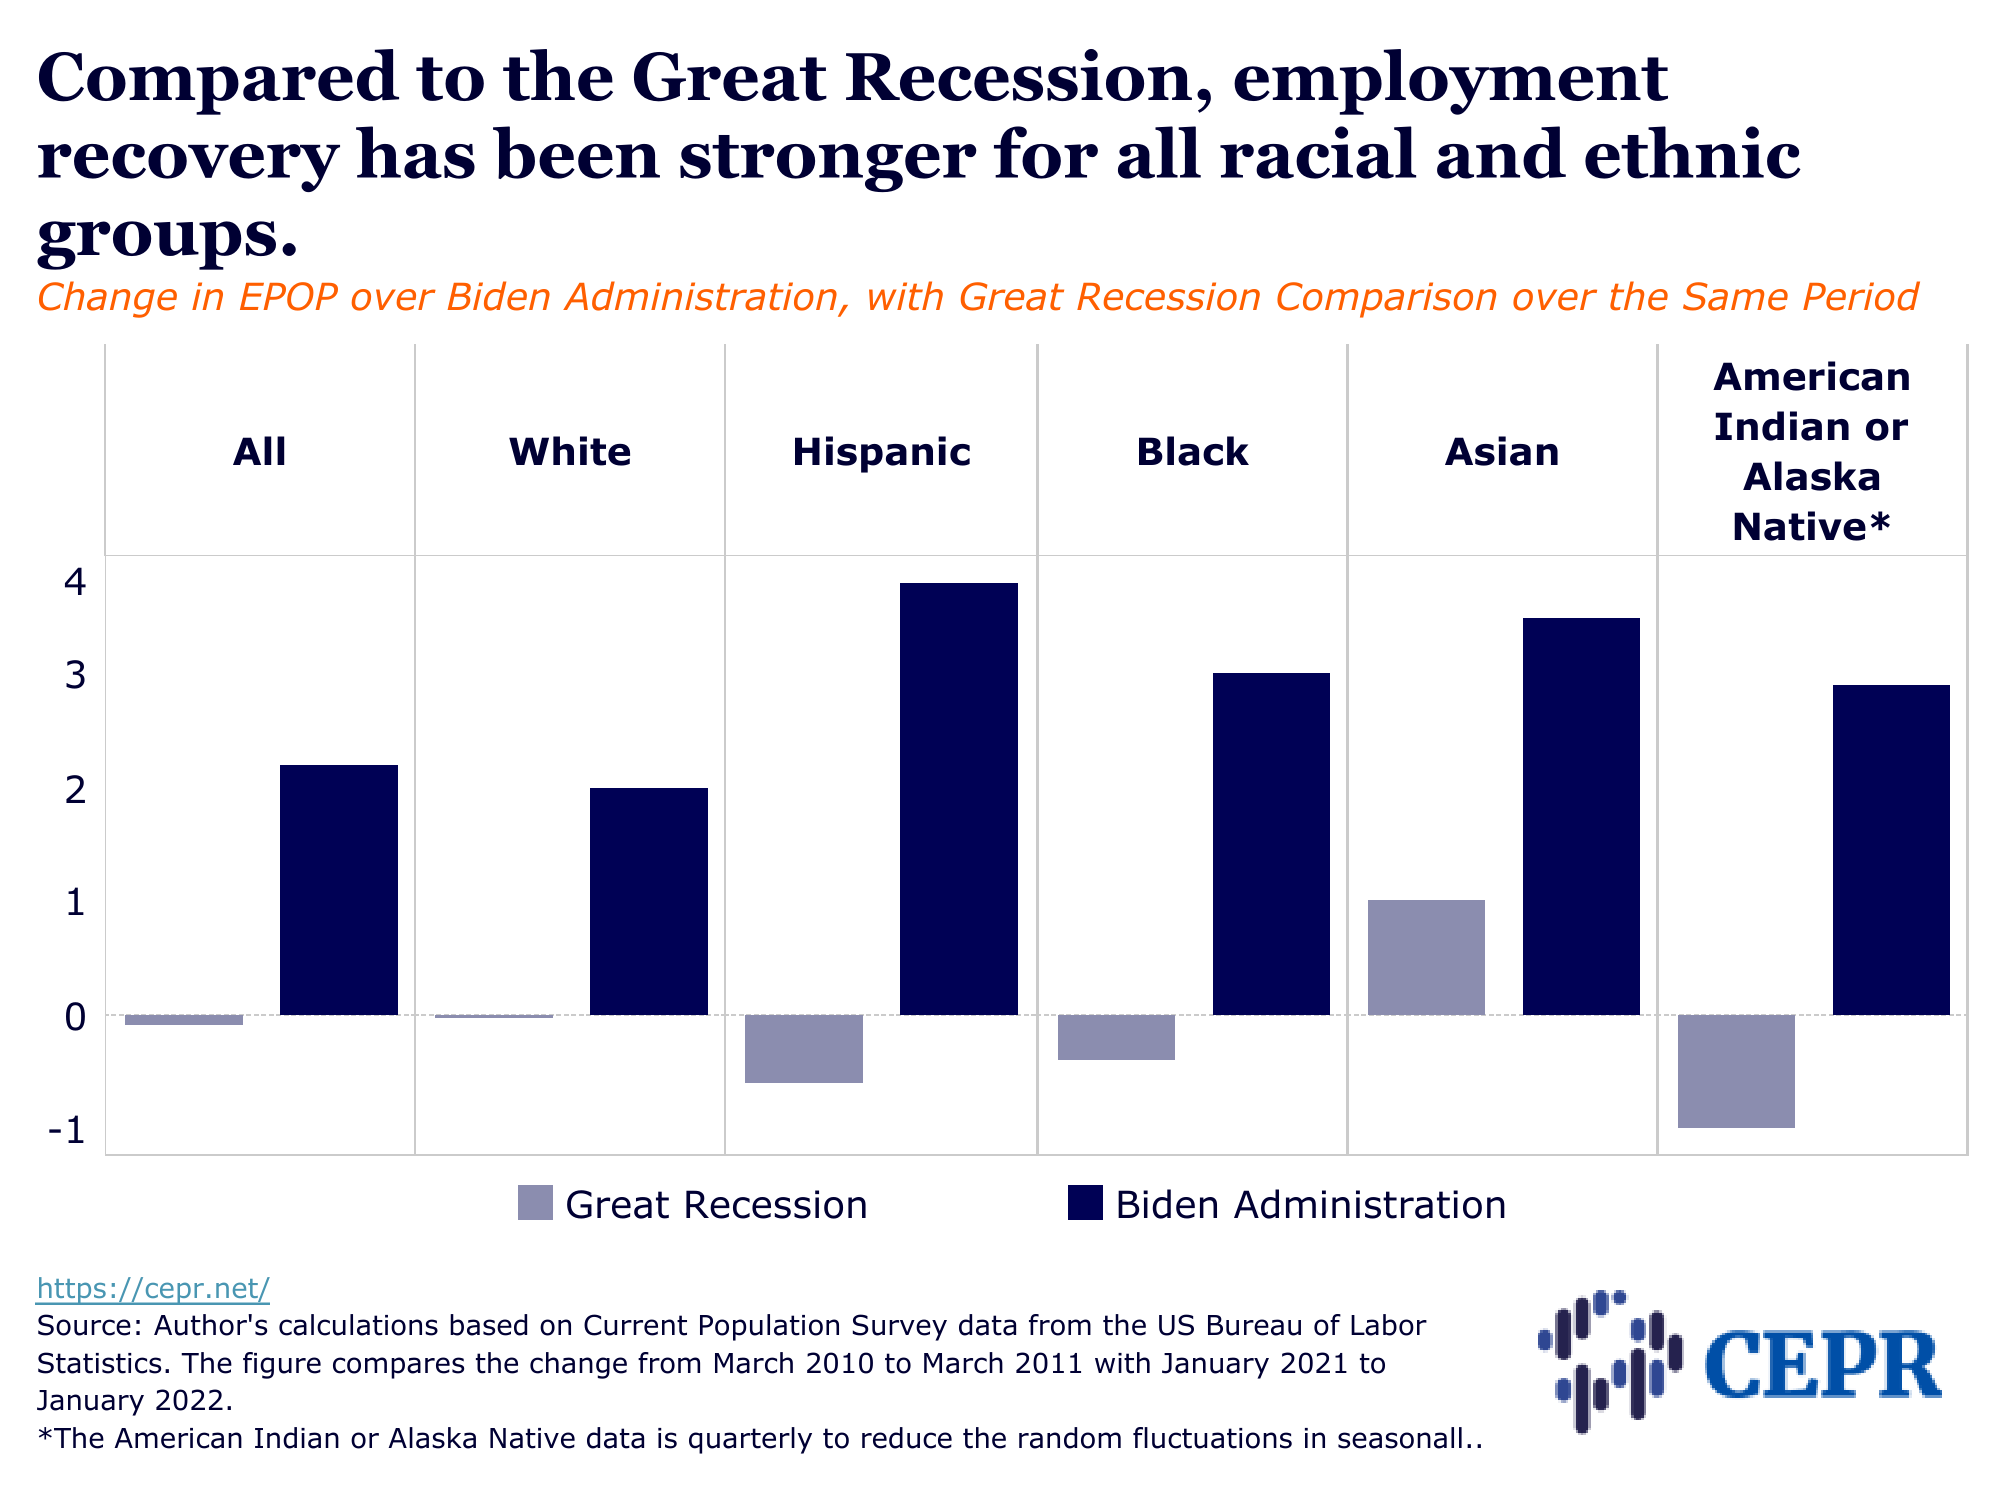
- Employment-to-population ratio (EPOP). Or the employment rate for all racial groups has increased from January 2021 to January 2022. The white population had a 2-percentage point increase in rate of employment. Hispanic’s experienced a 3.8 percentage point increase. People of color have also experienced stronger growth in employment. This growth helps to compensate for people of color’s greater rate of job loss during the recession.
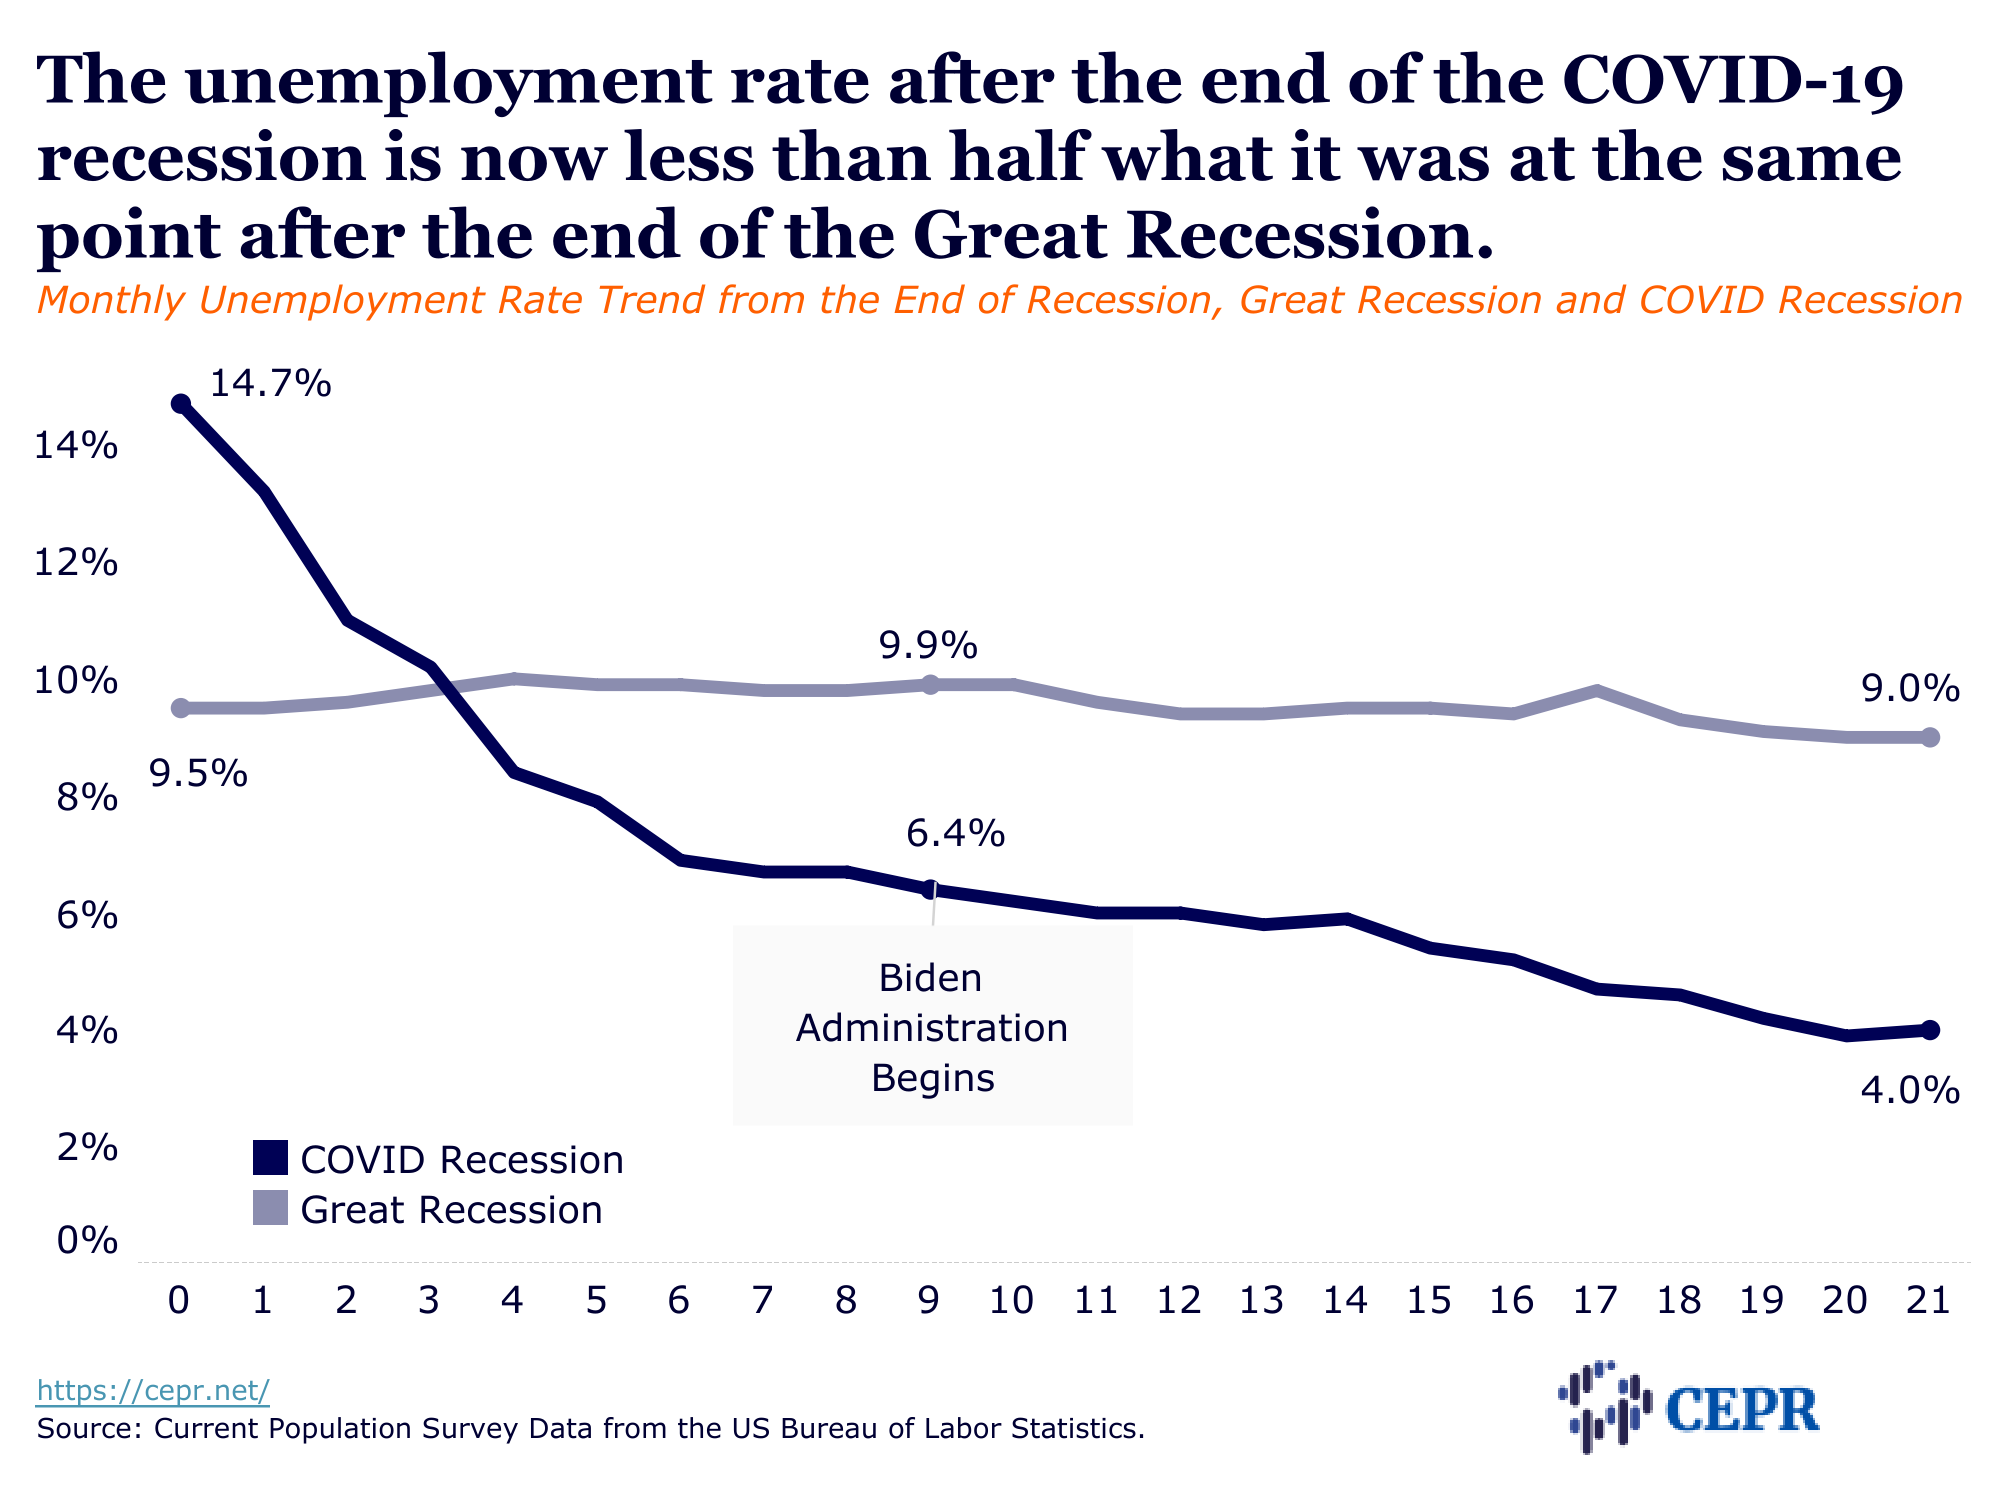
- U3 or the unemployment rate shows a similar picture as the employment rate. The graph below depicts a stronger decline in unemployment over the first year of the Biden administration than over a comparable time period during the Great Recession.
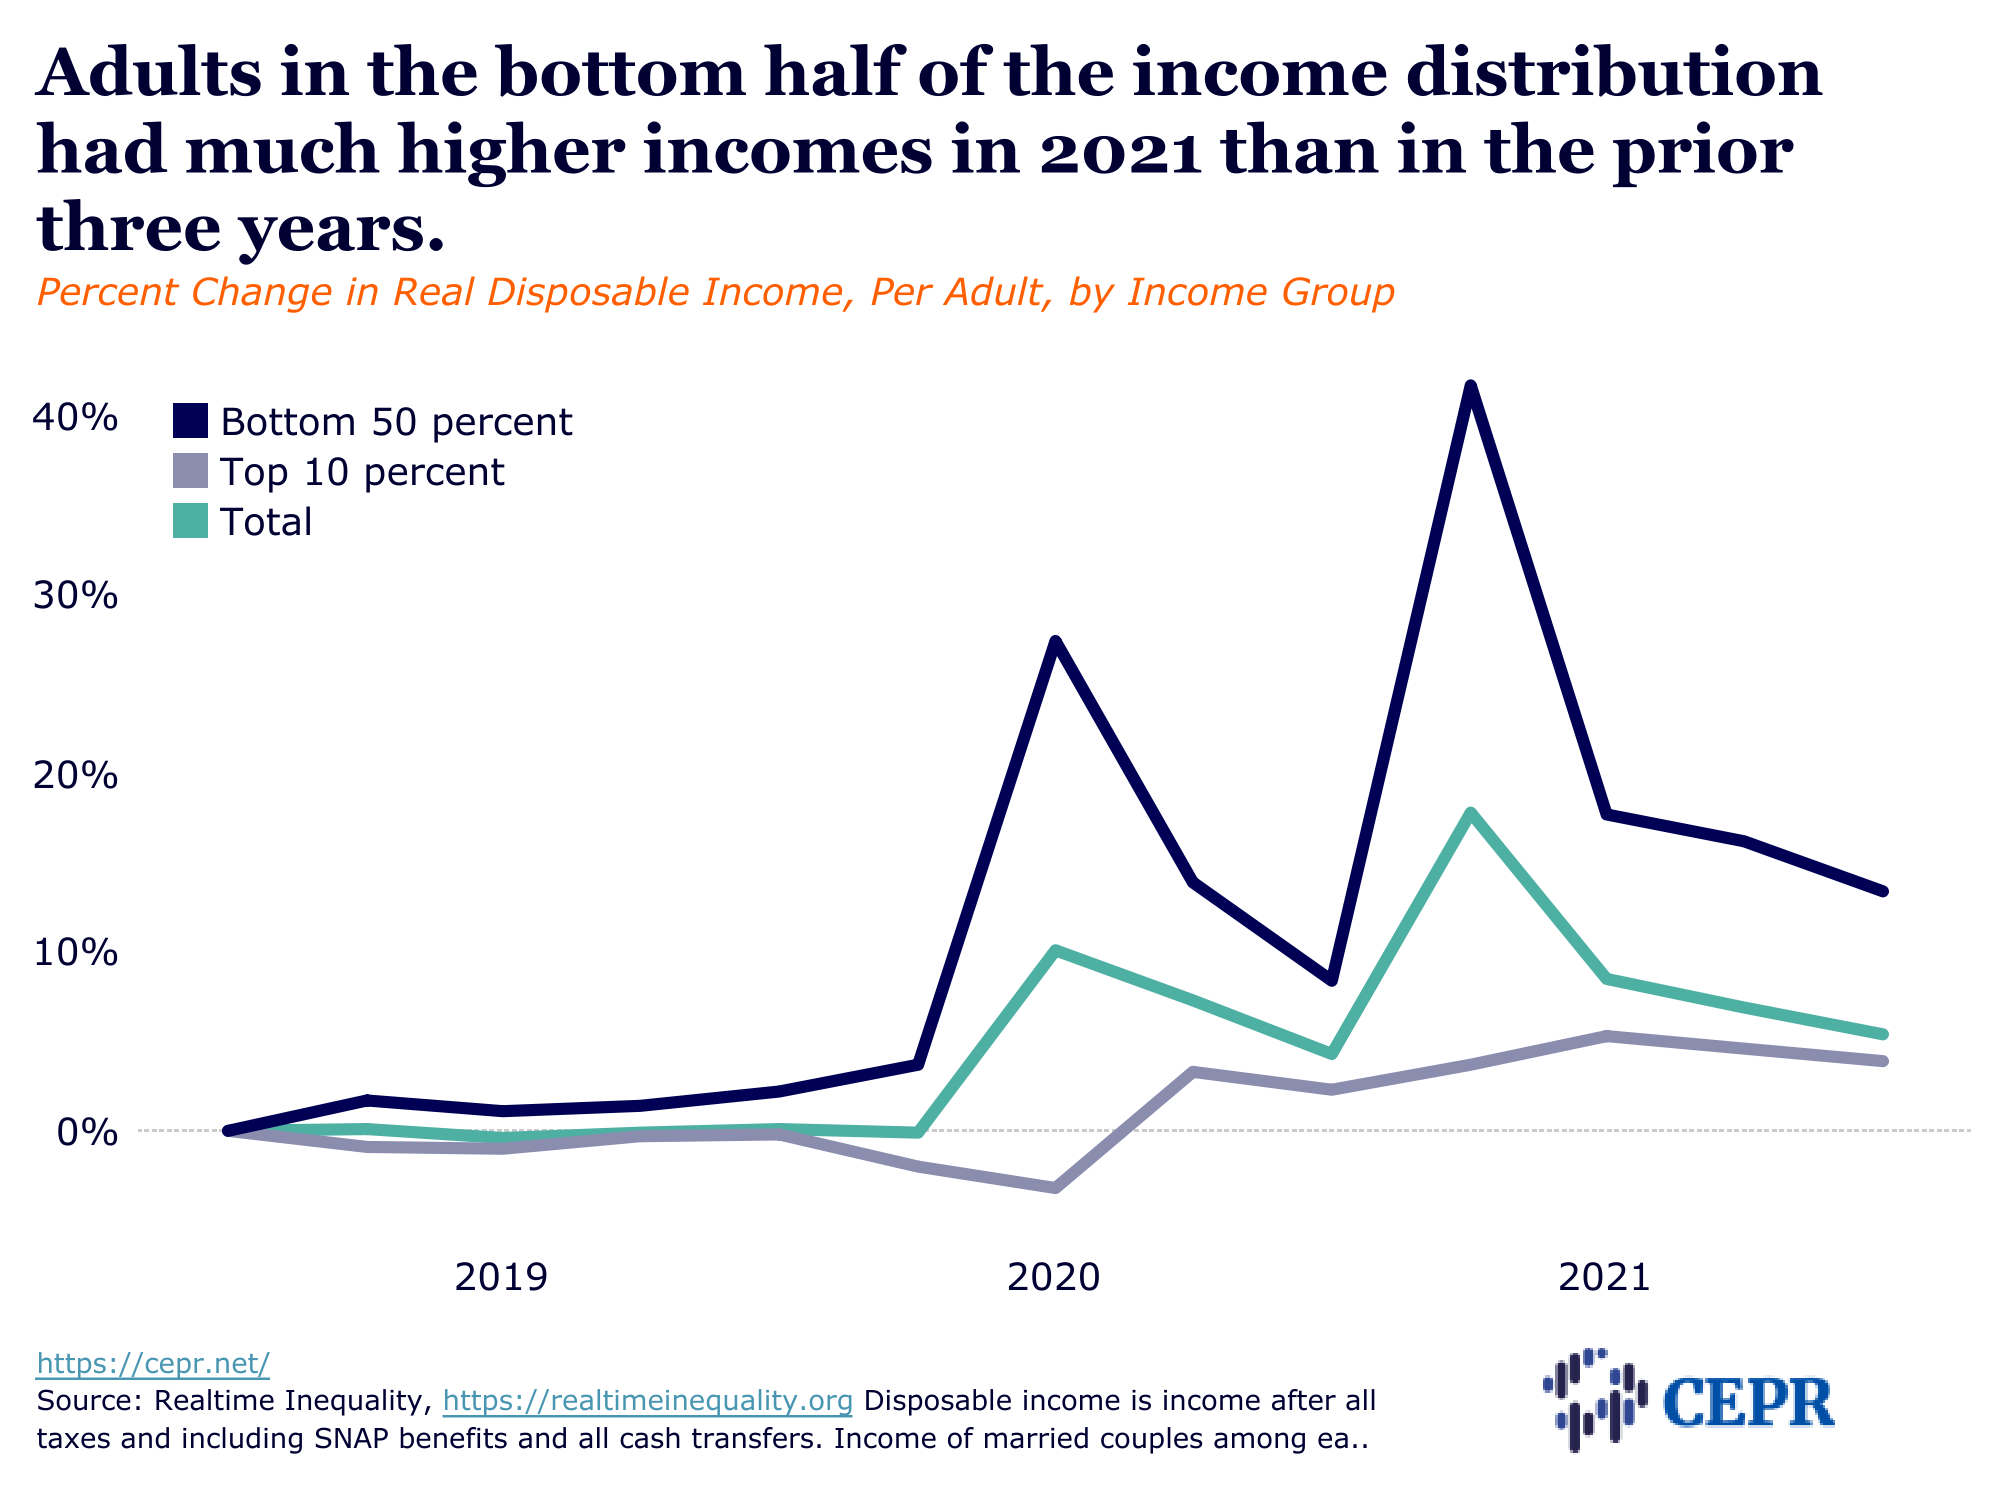
- Disposable income or available income after taking transfers and taxes into account, increased for most groups in 2020 and 2021 when compared to 2019. The increase being stronger in 2021.
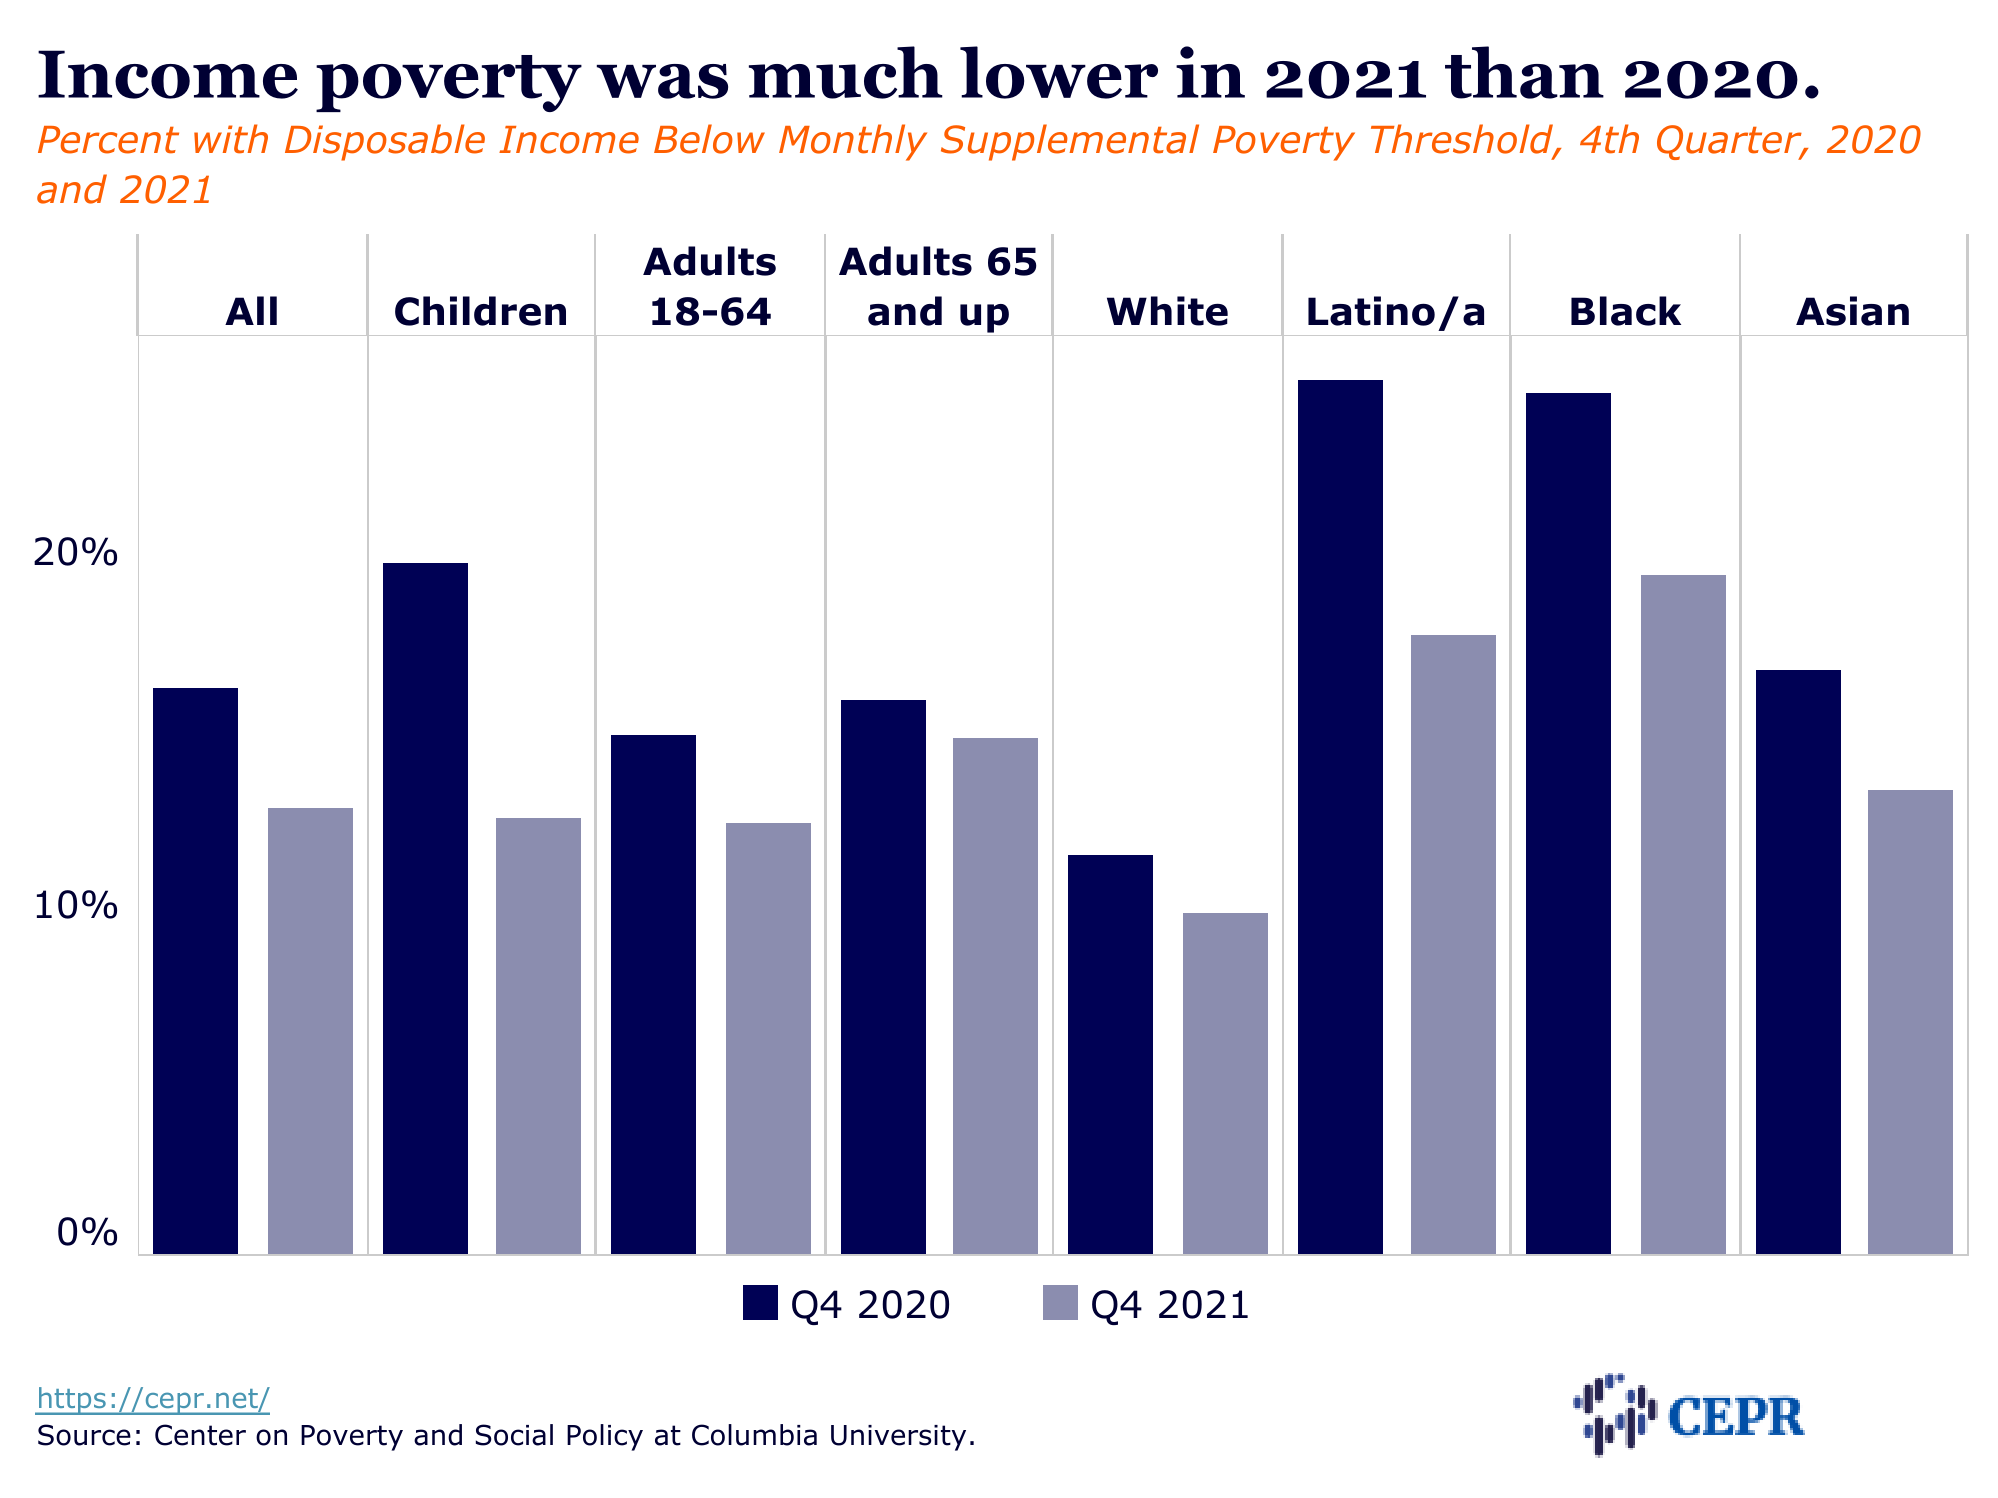
- There lacks a consistent set of measures to reflect the income needed to not live in poverty. There is little to question the decline of income poverty and other forms of material deprivation in 2021. This occurred particularly amongst households with children. Again, much of this occurred because of the Biden administration’s stimulus and Democrat’s support.
President Biden delivered his first State of the Union address on March 1, 2022. I am not a big fan on Joe Biden. I do not believe he can look beyond the tip of his nose when it comes to issues such as student loans. He was the biggest roadblock to forgiveness and he was instrumental to creating the blockage. Literally 40 million people carry debt of this type. Eight million of them are 51 years or older who will never pay it off. We can save Wall Street but we can not help people.
“Assessing the First Year of Biden, in Graphs,” Center for Economic and Policy Research (cepr.net), “A raft of people”
Pleasantly surprised. Which is saying a lot; I have … resentments that date to the demise of the (northwest) timber industry, and all that followed. Borrowing money to go to school to learn something new, exhaustive unemployment extensions when that didn’t pan out.
We may turn this around yet, but there’ll still be hard-times …
Ten Bears
Nope! Time to whack the peasants. Too many are working and getting paid for their labor. Powell’s efforts should have an impact soon.
Joe Biden’s presidency so far has proven to be successful on three important levels.
1. First and foremost Joe Biden has been anyone but Trump and simultaneously anyone but Hillary.
2. Unemployment is still flirting with its pre-pandemic low of 3.5% which is not bad, but also not entirely attributable to Ordinary Joe since it is where it was under Trump at the start of 1Q2020. OTOH, fiscal and trade deficits remain high, but the US lost its handle on those early in this century and to some extent by the mid-70’s. Exorbitant privilege is a wonderful thing until it isn’t, so those of us that will die before our bet is called will be lucky enough to never really know. People should really just eat, drink, and be merry now and stop fretting over inflation because they ain’t seen nuttin’ yet.
3. Ordinary Joe has not died of a heart attack. In a practical and decent world, then our backup pitcher would likely be as good or better than the guy on the mound, but does anyone know where such a world exists? If Joe can finish his term without a heart attack or global thermonuclear war, then that would be a resounding success.
Ron:
You need to start reading New Deal Democrat.
Every time, historically, when the world economy has been shut down or arrested for a substantial time, when it starts up again, as after World Wars, there is a period of inflation. This is completely and utterly predictable. That we seem to have been blindsided by this fact speaks more to our myopia than any conceivable policy missteps.
even if demand has barely recovered back to where was in 2019? and nobody seemed to complain about it back then
dw,
your brother SW was spot on. In a word – hysteresis. In economics, where you are is always in part caused by where you were. When production needs to be re-re-retrofitted to a new paradigm of market reality, then there is a supply lag that is often deeper and longer than the demand lag, which quickly recovers with employment, pay, and credit. Of course, price inflation is driven by economic rents and price setting opportunism as well as the balance of supply and demand.
And then you have OPEC attempting to solidify price gains, with collusion from Russia, made with spikes due to the Ukraine ‘special operation’. Those of us who remember 25 cents per gallon gasoline from 1968 know full well about this phenomenon, and all the events that led to quadrupling that price twice.
Yeah, Fred. I find the irony on gas price an endemic feature of the US political economy. We carp about carbon not being sufficiently priced, but when the price of carbon rises then the carping gets ever louder.
Ron
price setting today = price manipulation. Costs do not support the increases. Neither will anyone drive the speed limit to cut usage.
слава Україні
fun to talk about correlation between politics and GDP. but should we concentrate more on which politicians legislate pro-cyclical forces and which politicians legislate Contra cyclical mechanisms? since the Democrats have gained the position of King on the hill what have they done to the balance between Contra cyclical and pro-cyclical forces? allow correlation to fade out but causation to fade in! illuminate a scientific perspective!
parenthetically, thanks President Biden for supporting the Ukrainians!
You are welcome
PS: Dems are not the king of the hill. Too few Senators in their camp.
(The actual title of this op/ed is ‘Biden Knows How to Use Trump’. I think what it’s about is that Trump seems to be making a fool of himself while Biden just stays out of the news, lets that happen.)
OTOH …
Democrats are letting beatable election-denying Republicans cruise to reelection
Boston Globe – Oct 9
The Globe piece reminisces about Howard Dean’s noble 50-state strategy, which made a serious effort to elect Dems all over the country, but wasn’t all that successful really. It did perhaps energize the GOP to do their thing with gerrymandering wherever possible, alas.
“And the best way to tamp it down is to rebuild the political center”
Good luck with that. There are two major parties in America today. The GOP is the party of whackjob extremism. The Democratic party is the party of Rockefeller Republican conservatism. There is no significant liberal party in America. So is the “center” located between conservatism and right-wing extremism? Or is it located between the Democratic party and some inchoate liberal bloc? How do you “rebuild” on a nonexistent foundation?
The Dems (at least the progressive wing) is NOT ‘the party of Rockefeller Republican conservatism’, at least not exactly. It is where most if not all of those Rockefeller centrists ended up – I was one of them. So was Howard Dean.
That the Dems have such a big tent is no doubt a problem for our party, but that’s also what’s best for the good old USA, as long as we see fit to operate with two major parties. You want a third party? Good luck with that.
In fact, the only time in recent memory the Dems have been successful at electing presidents (especially the two-term ones) has been when they have gone with centrists. Hopefully Biden will be the third.
@Dobbs,
Please point out where I’ve advocated for a third party. Take all the time you need.
The Democratic Party is certainly a bigger tent than the GOP, but the progressive wing is a minor faction that has little influence. The so-called “center” is what we used to call “Rockefeller Republicans” back in the day. They dominate today’s Democratic Party by bringing money in exchange for sidelining more liberal policies like strengthening unions and universal healthcare.
If not a third party, what are you advocating then?
Perhaps that all Dems should just get more progressive?
The reality is that a plurality of voters are ‘independent’, probably some are leaning right, some left, some are just don’t know or don’t care.
Many will vote for Trump, sad to say, just because they want guv’mint to ‘stay out of their lives’ (except when they need help)
@Dobbs,
I’m advocating for the Democrats to go back to their pro-union, pro-working person roots.
The reality is that there are very few “independent” voters.
“Many will vote for Trump, sad to say, just because they want guv’mint to ‘stay out of their lives”
But they are happy to have gov’mint meddle in other peoples’ lives, particularly women and gay folk. Freedom for me but not for thee.
I suppose advocating that the Dem party become more ‘pro-Union’ is sort of like having it become more progressive. Officially, the Dem party is pretty much pro-Union as it is.
It was decided some years ago that those how were not registered in a party were to be called ‘unenrolled’ rather than ‘independent’. At the time it was because Ross Perot co-opted the term ‘independent’ for his new party.
It is arguably true that ‘unenrolled’ voters are just ‘disaffected’ from the two major parties, but on election day they pretty much must pick a party-bound candidate to vote for, alas. In that sense, there are no ‘independent voters. Voting for an actual ‘third-party’ candidate is a wasted vote, except if one is of an anarchistic inclination & an organized spoiler. And it is also true in most places that there’s a plurality of ‘unenrolled’ voters.
However, Trump supporters understand that foolishness is part of his immense charm, always poking sticks in the eyes of the establishment.
The irony of a billionaire commercial real estate developer poking sticks in the eyes of the establishment is not lost on me either. I knew that Trump’s narcissism had gone too far when he lost the support of Charles Koch.
That’s billionaire bad-boy real-estate developer, dontchaknow.
POLITICS The Koch network and other Trump allies are quietly backing his biggest GOP critic: Rep. Liz Cheney
CNBC – Aug 23
… Billionaire and conservative political backer Charles Koch is helping Cheney through i360, a data and technology company owned by his conglomerate, Koch Industries, according to financial database PitchBook and Federal Election Commission filings. …
(How’d that work out, anyway?)
@Dobbs,
As much as I hate Trump, Cheney is a right-wing fascist whose only virtue is that she isn’t a slave to Trumpism. I’m familiar with the cliche “the enemy of my enemy is my friend,” but be careful what you wish for. Hitler came to power because he was the enemy of Bolshevism.
I am not a Cheney fan either. You might think Trump would give her some ‘credit’ for not voting to impeach him both times, but NOOOO!
But I guess she still has some appeal to Charles Koch.
A piece in the NYT the other day had 2 up-for-grabs races for both GOP and Dems, in the Senate. If the Dems can just win 2 of them, they will be exactly where they are now, in quasi-control of the Senate without the super-majority needed for everything they would like to do, alas.
Fred:
True
Perhaps the Dem party can be taken apart and a new progressive party could be formed consisting only of previous Dem progressives. It would at least (probably) include almost all of the young voters currently expected to vote Dem.
That would conceivably leave the current Dem party, which would need a new name (Old Dems?), at about half the size (or perhaps 2/3) of the current Dem electorate. Three major parties then: roughly one quarter of the electorate being GOP, one quarter being New Dem, the remaining half (or a bit more) being Old Dem. Sure, it could work. But could it work well? The existing Red states would still all be with the GOP, so still control 30 state legislatures.
I expect it would be very chaotic.
For starters… Without electoral vote majorities, Presidential elections would end up in the House of Representatives (one vote per state) were they would almost always be decided in favor of the GOP. Afterwards, no Dem presidents (Old or New) for the foreseeable future.
Meanwhile…
Tulsi Gabbard announces she is leaving Democratic Party, calling it an ‘elitist cabal of warmongers’
ABC News – Oct 11