House price indexes: more evidence of a summer peak
House price indexes: more evidence of a summer peak
– by New Deal democrat
The Case Shiller and FHFA house price indexes were updated through July (technically, the average of May through July) this morning. Ordinarily I do not pay them too much mind, but this year they are very important in confirming a peak in house prices.
Although the FHFA index is seasonally adjusted, the Case Shiller index is not, so the best way to show them in comparison is YoY. Here are YoY% changes for the last 2 years of each through June (FRED has not yet posted today’s numbers):

Remember, my rule of thumb for non-seasonally adjusted data is that the peak is most likely when the YoY gain declines to only 1/2 of its maximum in the last 12 months. the YoY peak in the Case Shiller index was +20.6% in March and April. The peak for the FHFA index was 19.3% in July 2021. By that standard, although both decelerated to 12 month lows, at +15.8% and 13.9% respectively, neither has actually turned down, although the FHFA index is closer. And since the FHFA has a tendency to turn slightly ahead of the Case Shiller index, this strongly suggests that a sharp deceleration in the Case Shiller index YoY will start within a month or two.
As I said above, however, the FHFA purchase only index *is* seasonally adjusted, and that index, after increasing consistently by 1% or more from June 2020 through May 2022, declined -0.1% in June, and -0.6% in July:

So the seasonally adjusted data in the FHFA Index indicates that prices did peak in May.
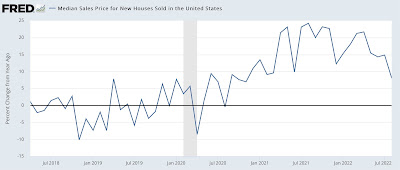
New home sales were also reported this morning. I’ll comment briefly on sales below, but let’s stick with prices first. These are also not seasonally adjusted. The median price of a new home YoY increased “only” +8.0% as of August, down from +24.2% in August of last year:

This confirms that new home prices have probably peaked as well.
Additionally, the maximum median YoY% change for existing homes in the past 12 months was last December at 15.8%. As of August the YoY increase was +7.7%, meaning those prices also probably peaked.
Summarizing the four measures of house prices, median prices of both new and existing homes appear to have peaked this summer. The FHFA Index suggests a peak either also happened this summer or is happening imminently. Only the Case Shiller index is probably several months away from peaking.
Finally as to prices, as I have written many times over the past 9 months, the CPI measure of housing, “owners equivalent rent,” – which is about 1/3rd of the entire index – lags actual house prices by about a year or more. Here are the YoY% changes of the house price indexes vs. OER (*2 for scale) over the past 20 years:

Through August, YoY% increases in OER have continued to accelerate. Since in the past episodes of significant downturns – 2001-2, 2005-6, and 2019-20, OER peaked about a year after the house price indexes, I suspect we will continue to see acceleration in OER through winter, or at least to the end of this year.
Further, in several months I expect the YoY increase in the FHFA index to be less than that of OER – which means if the Fed continues to raise rates at that point, it will be chasing a receding phantom.
Turning briefly to new home sales, they increased sharply from July’s 6 year low of 532,000 annualized to 685,000, a 4 month high – but still well below the general pace of the past several years:

This data series is heavily revised, so we will see if the increase survives next month. There is no reason to suspect any change in the overall downward trend.
