Existing home sales down 25%; price increases keep steamrolling on
Existing home sales now down 25% from peak; but price increases keep steamrolling on
Although existing home sales are less economically important than new home sales, what has been happening with their prices, given the experience of the housing bubble and bust 15 years ago, is of added importance.
The simple summary is that sales have declined precipitously, while price appreciation keeps stubbornly rolling on due to (still!) a severe lack of normal inventory.
Sales of existing homes declined 4.4% for the month, seasonally adjusted; 9.4% YoY; and 25% from their October 2020 peak. At 5.12 million annualized, sales were at the lowest level since June 2020:

In fact, pulling back 5 years, excluding the pandemic lockdown months, sales were at their lowest since January 2019 (note graph does not show this morning’s data):

This is very much a level consistent with an oncoming recession.
The story is completely different as to prices. At $416,000, the median price of an existing home increased 2.1% for the month, and 13.4% YoY (Note: prices aren’t seasonally adjusted, so the YoY view is the best measure; graph does not show this morning’s data):
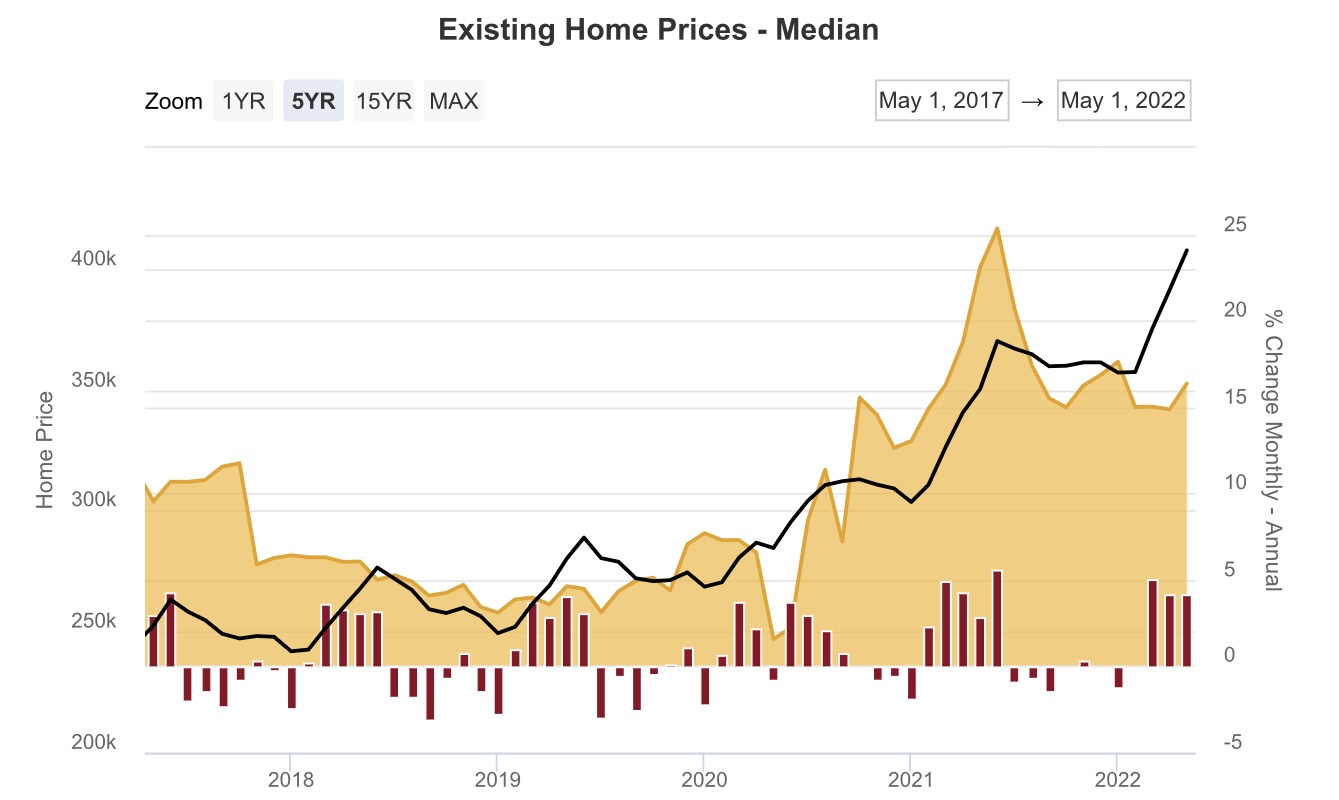
The peak in YoY growth in prices was May 2021, where prices increased 23.6% YoY. The low this year was April’s 10.4% YoY growth. Since my rule of thumb as to non-seasonally adjusted data is that a decline of 1/2 of peak YoY change is necessary for a real-time peak, we still are not at the point where prices are actually declining – although there are lots of anecdotal signs that we may be close.
The reason for this is in inventory. Last month I wrote that. “in May inventory was still down -4.1% YoY. Importantly, the NAR’s weekly update showed inventory increasing YoY in the last week of May and the first several weeks of June, so this may be the last hurrah for that metric.”
And indeed it was, as inventory in June was up 2.4% YoY:

A longer term look from the NAR’s new and active listing data, which goes back 6 years (note: seasonal peaks have typically occurred in May) shows that while *new* listings in June were higher than in any previous June except for 2019, active listings are still only about at 50% of their typical pre-pandemic levels:

New listings were up 100,000 YoY in June, but they need to increase to about +600,000 YoY to make up the total shortfall in active listings. Needless to say, we have quite a ways to go.
So price increases have rolled on. So far.