Coronavirus dashboard for July 27: likely at or past the BA.4&5 peak
Coronavirus dashboard for July 27: likely at or past the BA.4&5 peak
Let’s start with Biobot, since wastewater doesn’t lie. The bad news is, that it shows a nearly 50% increase between June 29 and July 20. The good news is, in the last week of that period, between July 13 and July 20, it only increased less than 4%, suggesting that the BA.5/July 4 superspreader celebration wave has peaked, at a level equivalent to 500,000 “real” cases (from a starting point of 350,000):

The regional breakdown shows that the only region where wastewater has not plateaued is the Midwest:

Meanwhile, the CDC variant data indicates that by the end of last week, BA.4&5 constituted 95% of all cases:

This is consistent with infections from these variants being at or past peak. All regions of the country had similar variant profiles. There is no new variant (in particular, BA.2.75) making any appearance.
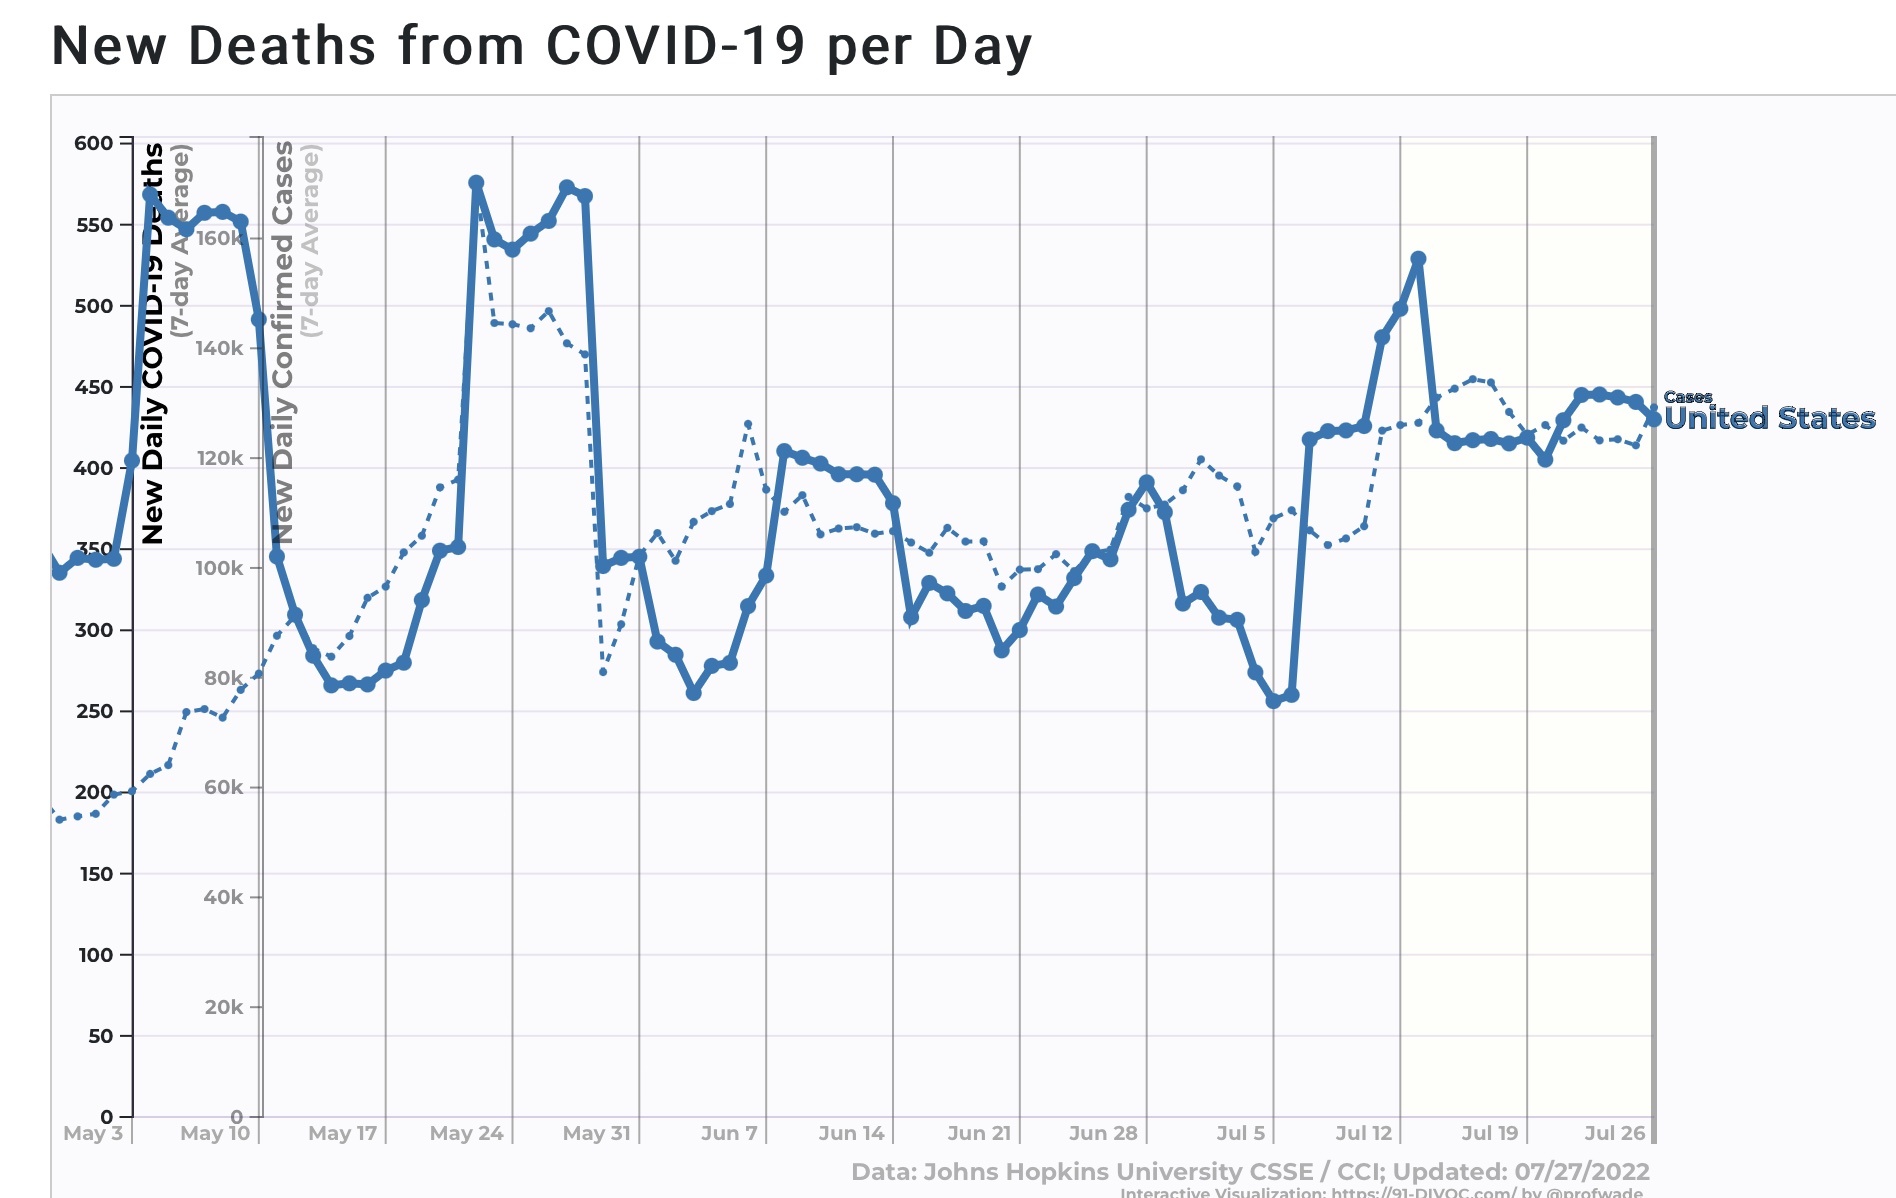
*Confirmed* cases (dotted line below) have remained between 120-130,000, with yesterday at 129,000. Deaths (solid line), at 429, have continued to plateau at roughly 100 more daily than in the April – June period (net the biweekly oscillations particularly in deaths are primarily an artifact of Florida’s reporting “system”):
Breaking down confirmed cases by Census region shows that only the Midwest shows a slight increase:

On the other hand, hospitalizations have continued to increase, to 46,700, consistent with evidence that BA.5 in particular is more virulent:

I think the BA.5 wavette has peaked, although whether we have a sustained plateau, or going into a substantial decline is completely unknown, but based on the experience of South Africa, which after the BA.4&5 wave declined to lows below even before the first wave of Omicron struck last November, I think the latter is more likely.