Q1 GDP negative; but more importantly, two of three long leading indicators have deteriorated
Q1 GDP negative; but more importantly, two of three long leading indicators have deteriorated
by New Deal democrat
First things first: yes, it was a negative GDP print. No, it doesn’t necessarily mean recession. I’ve been expecting weakness to show up by now ever since last summer; so here it is.
But the big culprits were non-core items. Personal consumption expenditures, even adjusted for inflation, were positive. The three big negatives were a big decline in exports vs. imports, followed in about equal measure by a decline in inventories and a downturn in defense production by the government. The inventory adjustment is temporary. So, most likely, was the downturn in defense production. We’ll see about exports and imports (supply chain issues!).
But there are two components of GDP which are helpful in finding out what lies ahead: real residential fixed investment (housing) and proprietors income (a proxy for business profits). Both of these have long and good track records as helping forecast the economy one year in advance. Here, the news was mixed, but a little more positive than negative.
Proprietors’ income (blue in the graph below) rose 1.2% nominally. Since unit labor costs have averaged an increase of 0.9% per quarter over the last year, they probably rose to a new high on an adjusted basis as well. This generally rises and falls with corporate profits (red), although it is not quite so leading. But since the latter won’t be reported for at least another month, it is a good placeholder:

So, this was a positive.
The news was more mixed in housing. Real private residential fixed investment rose slightly:

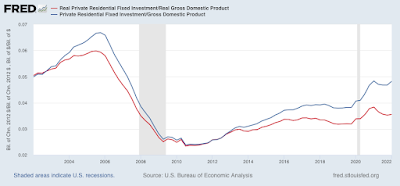
Further, both nominal and real residential fixed investment as a share of GDP (the actual measurement that is part of the long leading indicators) also rose for the quarter:

So far, so good.
The problem is that recessions have typically happened on average 7 quarters after the last peak in this measure. And even with the improvement in Q1, this measure is still below its peak of one year ago. So real residential investment is still a negative for forecasting purposes.
In addition to the above two long leading components of GDP, real money supply for March was reported on Tuesday, and the news wasn’t good there, either.
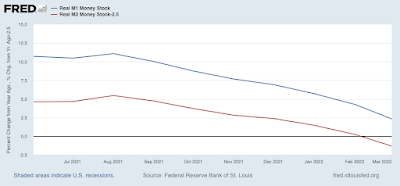
Recessions have typically occurred one year or more after real M1 turns negative, or real M2 is up by less than 2.5% from one year previous. Here’s what they look like through March:

Real M1 is up 2.4% YoY, and has deteriorated rapidly, although it is still a positive. Real M2 is also up less than 2.5%, which means it is consistent with an oncoming recession.
All in all, the picture continues to deteriorate, even though the profits component held up in Q1.

I think there must be something wrong with how GDP is being measured if reports show a decline in real GDP for the first quarter. Or at least I can’t understand why that would be happening. I mean there is more people working. New claims for unemployment are low. I don’t get it. Inflation may be higher than expected, but that should be pushing at least nominal GDP up, and even though inflation is higher, it is not so high that it should be interfering with production of goods and services. At least so I have been taught. Although many of the things I was taught about economics have turned out to be either somewhat iffy, or completely wrong in retrospect.
Is there a chance that the inflation adjustments made to nominal GDP estimates are overstating the impact of changing prices when trying to come up with the estimate of real GDP?
https://www.bea.gov/sites/default/files/2022-04/gdp1q22_adv.pdf
Gross Domestic Product, First Quarter 2022
(Advance Estimate)
Real gross domestic product (GDP) decreased at an annual rate of 1.4 percent in the first quarter of 2022 (table 1), according to the “advance” estimate released by the Bureau of Economic Analysis. In the fourth quarter, real GDP increased 6.9 percent.
The GDP estimate released today is based on source data that are incomplete or subject to further revision by the source agency (refer to “Source Data for the Advance Estimate” on page 3). The “second”
estimate for the first quarter, based on more complete data, will be released on May 26, 2022…
[Lots more at link above. Under pandemic conditions then YoY for 1st Q would be subject to numerous shocks conditions, but right now 1Q to the previous holiday concentrated almost out of the woods Q4 is just funny.]
Let’s talk about behavioral economics – but why bother when going off on wild tangents is so much fun.
Thanks Ron. The link was good but did not offer much that I didn’t already understand. I don’t know much about behavioral economics to be honest. But I don’t see that my questions go off on any wild tangents. At least not today 🙂
Jerry,
Sorry to give you the wrong impression. You were asking valid questions in context of classical economics from which this GDP downturn post is drawing. However, it is those contexts themselves that are off on wild tangents given the present context. Classical economics, to the extent that it is applicable at all nowadays, does not have contingent models that support either financial, energy supply, or pandemic shocks or their recoveries. Back in the 70’s (energy supply) or after 2008 (financial) or now (pandemic), then we are planting our economic expectations upon unbroken ground. Rational expectations and efficient market hypothesis are convenient rationalizations of classical economics, albeit deeply flawed under the best of circumstances. Well that is the general nature of it.
Specifically, from the previously referenced BEA link, then the proximate cause of the 1Q2022 GDP downturn, was the huge upturn in GDP recorded for 4Q2021. Of course, this is entirely rational, but not in the classical economics sense which wears blinders in the daylight.
Which does not mean that everything is coming up roses now. It just means that the devil is in the details, not in the quarter to quarter aggregates. Can the US economy adjust to much higher oil prices on an enduring basis? Well, we better be able to given both peak oil and climate change. Can the US economy swing back to domestic product substitution for necessary products in short supply because of trade related supply chain failures? In the long run again we have no choice although it will negatively affect the extraction of economic rents by large corporations. Periodic economic shocks do not constitute the end of the US economy, but they will certainly change it – for the better I might add.
Since the dawn of the industrial revolution the prevailing reality has been that the rich get richer while the poor get poorer, even if only in a relative sense. This may change. Inequality may decline while everyone gets poorer in an absolute sense.
Jerry,
Better yet – see Rosser’s Major Economic Confusion posted on AB today.
https://www.khanacademy.org/economics-finance-domain/macroeconomics/macro-economic-indicators-and-the-business-cycle/macro-the-circular-flow-and-gdp/a/measuring-the-size-of-the-economy-gross-domestic-product-cnx
Measuring the size of the economy: gross domestic product
Read about GDP and how we measure it.
Key points
*GDP is measured by taking the quantities of all final goods and services produced and sold in markets, multiplying them by their current prices, and adding up the total.
Jerry, first let’s be clear what GDP measures; the real output of goods and services, not their dollar value…and it has nothing to do with employment or how much people are being paid….so you could feasibly have a falling GDP with everyone employed, if they’re not as productive as they were in the previous quarter…
higher prices serve to create the illusion of greater economic activity…in current dollars, our first quarter GDP grew at a 6.48% annual rate, increasing from what would work out to be a $24,002.8 billion a year output rate in the 4th quarter of last year to a $24,382.7 billion annual rate in the 1st quarter of this year…however, once we adjust for prices that averaged 8% higher economy wide, we end up with the negative print…
let me attempt to contrive an illustration of what’s going on here…imagine that your entire economy is represented by one apple orchard…the change in GDP represents the percentage change in the number of apples produced in one period prior to the prior period; it doesn’t care how you treat your migrant farm workers or how much they’re being paid…..so let’s say Jerry’s orchard produced 10,000 apples last year, and 10,500 apples this year; your GDP would have increased 5%, right?
so if you wanted to measure the change in your GDP year after year, you’d set up a way to count apples, wouldn’t you? however, that’s not what we’ve done…the only factor we have to determine the output of your orchard is the aggregate sales of apples for this year….however, we also know the average change in the price of apples from year to year, so we use that price adjustment to estimate the number of apples that have been produced…
now we’re going to add a complication to our example….some of the apples that were sold this year were not from your orchard…Ron’s orchard represents an overseas orchard that sent some apples to your country to be sold, and they were imported at different price than your average…so to determine how many of the apples that sold in our country came from Jerry’s orchard, we have to adjust Ron’s apples for their price to arrive at a quantity of imported apples, and then subtract that quantity from the total we’d previously arrived at to determine your output…
one more complication…you also store some apples from year to year, & for the sake of our illustration we will posit that their condition does not deteriorate, and they’ll be good as fresh picked a year from now…again, instead of counting the number of apples you have in storage each year, you assign a dollar value to them that changes over time…so after adjusting for inflation or deflation of those stored apples, you can determine what the actual change was in the number of apples you have stored vis a vis those stored a year ago; if it decreased, we subtract that number from your orchard’s GDP total, while if it increased, we add that to your total…
with those examples, we can explain what happened to first quarter GDP….the dollar value of apples sold in the first quarter was much higher than during the previous period, but their price was also much higher, so the actual increase in apples sold wasn’t very large….and some of those apples that were sold in the first quarter came out of the apples we stored previously….then we found that the number of the apples that sold that were from Ron’s economy were greater than the total increase in apples that sold in our country during the quarter…ergo, the apple output of Jerry’s orchard was lower in the first quarter than in the 4th quarter of last year…
hope that helps..