Nat. Gas Rigs +32 Mo, DUCs low, Completions 17% below Avg.
RJS, Focus on Fracking
Summary: Natural gas rigs at a 32 month high; DUCs at a record low; 4.5 month Drilled but Uncompleted Wells (DUC) backlog is lowest in 7 years; completions remain 17% below prepandemic average…
This Week’s Rig Count
The number of drilling rigs running in the US increased for the 74th time over the prior 86 weeks during the week ending May 20th, but still remained 8.3% below the prepandemic rig count . . . Baker Hughes reported that the total count of rotary rigs drilling in the US increased by fourteen to 728 rigs this past week, which was also 273 more rigs than 455 rigs that were in use as of the May 21st report of 2021, but was still 1,201 fewer rigs than the shale era high of 1,929 drilling rigs that were deployed on November 21st of 2014, a week before OPEC began to flood the global market with oil in an attempt to put US shale out of business….
The number of rigs drilling for oil was up by 13 to 576 oil rigs during this week, after rigs targeting oil had increased by 6 during the prior week, and there are now 220 more oil rigs active now than were running a year ago, even as they still amount to just 35.8% of the shale era high of 1609 rigs that were drilling for oil on October 10th, 2014, and as they are still down 15.7% from the prepandemic oil rig count. At the same time, the number of drilling rigs targeting natural gas bearing formations rose by 1 to 150 natural gas rigs, which was the most natural gas rigs deployed since September 13th, 2019, up by 51 natural gas rigs from the 99 natural gas rigs that were drilling during the same week a year ago, even as they were still only 9.3% of the modern high of 1,606 rigs targeting natural gas that were deployed on September 7th, 2008. Iin addition to rigs targeting oil and gas, Baker Hughes continues to show two “miscellaneous” rigs active; one is a rig drilling vertically for a well or wells intended to store CO2 emissions in Mercer county, North Dakota, and the other is also a vertical rig, drilling 5,000 to 10,000 feet into a formation in Humboldt county Nevada that Baker Hughes doesn’t track . . . a year ago, there were no such “miscellaneous” rigs running…
The offshore rig count in the Gulf of Mexico remained at seventeen rigs this week, with all of this week’s Gulf rigs drilling for oil in Louisiana waters. That’s three more than the count of offshore rigs that were active in the Gulf a year ago, when all 14 Gulf rigs were drilling for oil offshore from Louisiana. In addition to rigs drilling in the Gulf, there’s also an offshore rig drilling in the Cook Inlet of Alaska, where natural gas is being targeted at a depth greater than 15,000 feet . . . a year ago, there were no offshore rigs other than those deployed in the Gulf of Mexico . . . in addition to rigs offshore, we also have a water based directional rig, drilling for oil at a depth between 10,000 and 15,000 feet, inland in the Galveston Bay area, while during the same week of a year ago, there was also one such “inland waters” rig deployed…
The count of active horizontal drilling rigs was up by 13 to 664 horizontal rigs this week, which was also 252 more rigs than the 412 horizontal rigs that were in use in the US on May 21st of last year, but still 51.7% less than the record 1,374 horizontal rigs that were drilling on November 21st of 2014 . . . at the same time, the directional rig count was up by 1 to 39 directional rigs this week, and those were up by 11 from the 28 directional rigs that were operating during the same week a year ago…meanwhile, the vertical rig count was unchanged at 25 vertical rigs this week, while those were up by 10 from the 15 vertical rigs that were in use on May 21st of 2021….
The details on this week’s changes in drilling activity by state and by major shale basin are shown in our screenshot below of that part of the rig count summary pdf from Baker Hughes that gives us those changes . . . the first table below shows weekly and year over year rig count changes for the major oil & gas producing states, and the table below that shows the weekly and year over year rig count changes for the major US geological oil and gas basins . . . in both tables, the first column shows the active rig count as of May 20th, the second column shows the change in the number of working rigs between last week’s count (May 13th) and this week’s (May 20th) count, the third column shows last week’s May 13th active rig count, the 4th column shows the change between the number of rigs running on Friday and the number running on the Friday before the same weekend of a year ago, and the 5th column shows the number of rigs that were drilling at the end of that reporting week a year ago, which in this week’s case was the 21st of May, 2021…
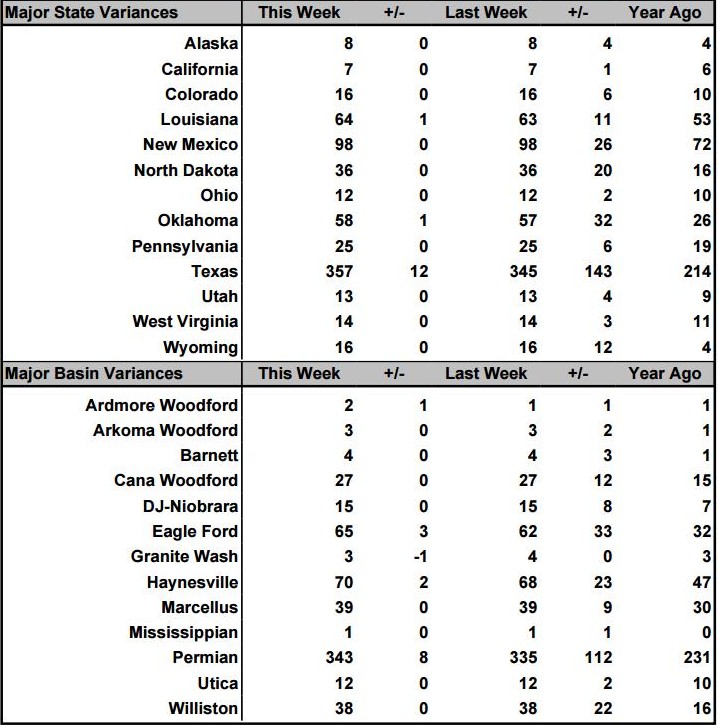
As you can see, this week’s increase was led by Texas, which comes on the heels of an unusual four week period when Texas activity had actually netted a one rig decrease. So we’ll start by checking the Rigs by State file at Baker Hughes for the changes in Texas Permian, where we find that two rigs were added in Texas Oil District 8, which is the core Permian Delaware, and that three rigs were added in Texas Oil District 7C, which includes the northernmost counties in the Permian Midland, and two more rigs were added in Texas Oil District 8A, which covers the southern counties in the Permian Midland. Since the national Permian rig count was up by eight and there were no additions in New Mexico, that means the rig that was added in Texas Oil District 7B, which includes a county in the easternmost Permian Midland, was also a Permian basin addition . . . elsewhere in Texas, we find that two rigs were added in Texas Oil District 1, that a rig was added in Texas Oil District 3, and that another rig was added in Texas Oil District 4. Three of those four account for the three oil rig increase in the Eagle Ford shale, while the other is targeting a basin that Baker Hughes doesn’t track, possibly the Austin Chalk formation, which sits atop the Eagle Ford shale in parts of its range. Texas also had a rig added in Texas Oil District 6, which accounts for one of the rigs added to the Haynesville shale, and a rig pulled out of Texas Oil District 10, which accounts for the rig lost in the Granite Wash basin in the panhandle region . . . the only changes outside of Texas were an oil rig addition in Oklahoma’s Ardmore Woodford, and a rig added in Louisiana’s Haynesville shale . . . one of the Haynesville shale additions was a natural gas rig, the other was targeting oil, and there are now three oil directed rigs running in the mostly gassy Haynesville . . . if anyone needs to know where those Haynesville shale oil rigs are, that can be determined by tediously checking the individual well records in the North America Rotary Rig Count Pivot Table (Feb 2011 – Current)..
DUC well report for April
Monday of this week saw the release of the EIA’s Drilling Productivity Report for May, which included the EIA’s April data on drilled but uncompleted (DUC) oil and gas wells in the 7 most productive shale regions (shown under the report’s tab 3) . . . that data showed a decrease in uncompleted wells nationally for the 23rd consecutive month in April, as both completions of drilled wells and drilling of new wells increased in April, but remained well below average pre-pandemic levels . . . for the 7 sedimentary regions covered by this report, the total count of DUC wells decreased by 70 wells, falling from 4,293 DUC wells in March to 4,223 DUC wells in April, which was the lowest number of US wells left uncompleted on record, and also 36.1% fewer DUCs than the 6,611 wells that had been drilled but remained uncompleted as of the end of April of a year ago…this month’s DUC decrease occurred as 874 wells were drilled in the 7 regions that this report covers (representing 87% of all U.S. onshore drilling operations) during April, up from the 825 wells that were drilled in March, while 944 wells were completed and brought into production by fracking them, up by 7 from the 937 well completions seen in March, and up by 146 from the 798 completions seen in April of last year . . . at the April completion rate, the 4,223 drilled but uncompleted wells remaining at the end of the month represents a 4.5 month backlog of wells that have been drilled but are not yet fracked, down from the 4.6 month DUC well backlog of a month ago, and the lowest backlog since December 2014, despite a completion rate that is still roughly 20% below 2019’s pre-pandemic average…
Only the oil producing regions saw a net DUC well decrease April, since the natural gas producing Haynesville shale saw an increase in DUCs that was greater than the Appalachian DUC decrease . . . the number of uncompleted wells remaining in the Permian basin of west Texas and New Mexico decreased by 46, from 1,302 DUC wells at the end of March to 1,256 DUCs at the end of April, as 388 new wells were drilled into the Permian basin during April, while 434 already drilled wells in the region were being fracked. In addition, the number of uncompleted wells remaining in Oklahoma’s Anadarko basin decreased by 12, falling from 740 at the end of March to 728 DUC wells at the end of April, as 55 wells were drilled into the Anadarko basin during April, while 68 Anadarko wells were completed. At the same time, DUC wells in the Niobrara chalk of the Rockies’ front range decreased by 8, falling from 317 at the end of March to a record low of 309 DUC wells at the end of April, as 96 wells were drilled into the Niobrara chalk during April, while 104 Niobrara wells were completed. Meanwhile, there was a decrease of 7 DUC wells in the Bakken of North Dakota, where DUC wells fell from 426 at the end of March to a record low of 419 DUCs at the end of April, as 69 wells were drilled into the Bakken during April, while 76 of the drilled wells in the Bakken were being fracked. In addition, DUCs in the Eagle Ford shale of south Texas decreased by 6, from 642 DUC wells at the end of March to a record low of 636 DUCs at the end of April, as 100 wells were drilled in the Eagle Ford during April, while 106 already drilled Eagle Ford wells were being fracked….
Among the natural gas producing regions, the drilled but uncompleted well count in the Appalachian region, which includes the Utica shale, fell by 3 wells, from 471 DUCs at the end of March to a record low of 468 DUCs at the end of April, as 92 wells were drilled into the Marcellus and Utica shales during the month, while 95 of the already drilled wells in the region were fracked. On the other hand, the uncompleted well inventory in the natural gas producing Haynesville shale of the northern Louisiana-Texas border region rose by 12, from 395 DUCs in March to 407 DUCs by the end of April, as 73 wells were drilled into the Haynesville during February, while 61 of the already drilled Haynesville wells were fracked during the same period. Thus, for the month of April, DUCs in the five major oil-producing basins tracked by this report (ie., the Anadarko, Bakken, Niobrara, Permian, and Eagle Ford) decreased by a total of 79 wells to 3,348 DUC wells, while the uncompleted well count in the major natural gas basins (the Marcellus, the Utica, and the Haynesville) increased by net of 9 wells to 875 wells, although as this report notes, once into production, more than half the wells drilled nationally will produce both oil and gas…
this week’s report showed the first decrease in rig activity in 31 months; two oil rigs were pulled out of the Gulf of Mexico and a natural gas rig was added in Oklahoma’s Arkoma Woodford, and all other changes nationally cancelled each other out..
i have since checked for details on those Haynesville shale oil rigs i had referred to above…there had been an oil rig drilling in the Haynesville shale under 10,000 feet in Panola County, Texas, last week that has since been pulled out, while the other two Haynesville shale oil rigs are in Caddo Parish, Louisiana, are drilling at a depth of around 15,000 feet in the northwest corner of the state….all other Haynesville shale rigs are targeting natural gas..