Commercial crude at new low, total US supply lowest since January 2012; gasoline demand at 11 month low
RJS, Focus on Fracking,
Strategic Petroleum Reserve at a new 19 year low; commercial crude inventories fall to 45 month low, total US oil supplies lowest since January 20th 2012; implied gasoline demand at 11 month low; largest jump in drilling rigs since April 1st as the Haynesville and the Marcellus are targeted for oil
This Week’s Rig Count
The number of drilling rigs running in the US increased for the 58th time over the past 69 weeks during the week ending January 14th, but they still remained 24.0% below the pre-pandemic rig count . . . Baker Hughes reported that the total count of rotary rigs drilling in the US increased by thirteen to 601 rigs this past week, which was also 228 more rigs than the pandemic hit 373 rigs that were in use as of the January 15th report of 2021, but was also still 1,328 fewer rigs than the shale era high of 1,929 drilling rigs that were deployed on November 21st of 2014, a week before OPEC began to flood the market with oil in an attempt to put US shale out of business….
The number of rigs drilling for oil was up by 11 to 492 oil rigs during this week, after they had increased by 1 during the prior week, and there are now 205 more oil rigs active now than were running a year ago, even as they still amount to just 30.6% of the shale era high of 1609 rigs that were drilling for oil on October 10th, 2014at the . . . same time, the number of drilling rigs targeting natural gas bearing formations was up by 2 to 109 natural gas rigs, which was also up by 24 natural gas rigs from the 85 natural gas rigs that were drilling during the same week a year ago, but still only 6.9% of the modern high of 1,606 rigs targeting natural gas that were deployed on September 7th, 2008 . . . however, note that last year’s rig count also included a rig that Baker Hughes had classified as “miscellaneous’, while there are no such “miscellaneous’ rigs deployed this week…
The Gulf of Mexico rig count was up by 2 to 18 rigs this week, with seventeen of this week’s Gulf rigs drilling for oil in Louisiana waters and another rig drilling for oil in Alaminos Canyon, offshore from Texas….that’s now two more Gulf rigs than the 16 rigs that were active in the Gulf a year ago, when 15 Gulf rigs were drilling for oil offshore from Louisiana and one was deployed for oil in Texas waters…since there is not any drilling off our other coasts at this time, nor was there a year ago, the Gulf rig counts are equal to the national offshore totals for both years….
In addition to those rigs offshore, we now have 2 water based rigs drilling inland; one is a horizontal rig targeting oil at a depth of between 5000 and 10,000 feet, drilling from an inland body of water in Plaquemines Parish, Louisiana, near the mouth of the Mississippi, and the other is a directional rig drilling for oil at a depth of over 15,000 feet in the Galveston Bay area . . . however, the inland waters rig count of two is still down from the three inland waters rigs that were drilling a year ago..
The count of active horizontal drilling rigs was up by 9 to 541 horizontal rigs this week, which was also 209 more rigs than the 332 horizontal rigs that were in use in the US on January 15th of last year, but still 61.3% less than the record 1,374 horizontal rigs that were deployed on November 21st of 2014….at the same time, the directional rig count was up by 2 to 35 directional rigs this week, and those were also up by 13 from the 22 directional rigs that were operating during the same week a year ago . . . in addition, the vertical rig count was also up by 2 rigs to 25 vertical rigs this week, and those were also up by 6 from the 19 vertical rigs that were in use on January 15th of 2021….
The details on this week’s changes in drilling activity by state and by major shale basin are shown in our screenshot below of that part of the rig count summary pdf from Baker Hughes that gives us those changes . . . the first table below shows weekly and year over year rig count changes for the major oil & gas producing states, and the table below that shows the weekly and year over year rig count changes for the major US geological oil and gas basins . . . in both tables, the first column shows the active rig count as of January 14th, the second column shows the change in the number of working rigs between last week’s count (January 7th) and this week’s (January 14th) count, the third column shows last week’s January 7th active rig count, the 4th column shows the change between the number of rigs running on Friday and the number running on the Friday before the same weekend of a year ago, and the 5th column shows the number of rigs that were drilling at the end of that reporting week a year ago, which in this week’s case was the 15th of January, 2021..
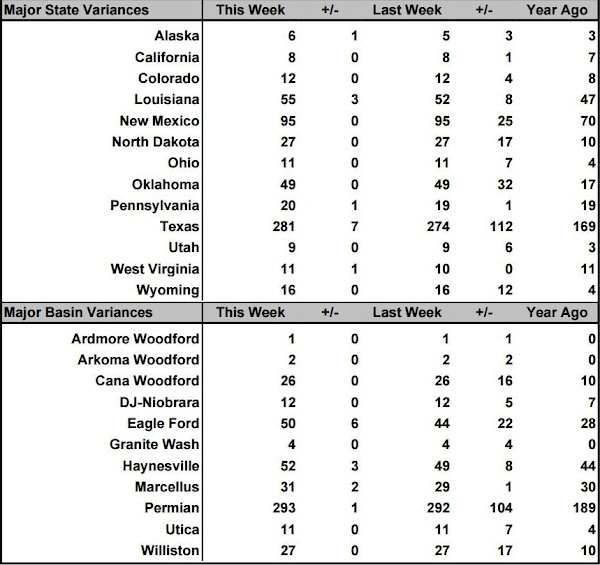
Even as Texas again led this week’s drilling increase, most new activity in the state was centered in the Eagle Ford shale, rather than in the dominant Permian basin…by checking the Rigs by State file at Baker Hughes for possible changes in that basin, we find that two rigs were pulled out of Texas Oil District 1, but that four rigs were added in Texas Oil District 2, and two more rigs were added in Texas Oil District 4…since the Eagle Ford rig count increased by 6, we have to assume that the two rigs removed from District 1 had not been targeting the Eagle Ford, but rather some other basin that Baker Hughes does not track . . . elsewhere in Texas, we had two rigs added in Texas Oil District 6, which should account for two of the Haynesville shale rig additions, and another rig added in Texas Oil District 8A, which would account for the Permian basin increase..
Meanwhile, the Louisiana rig count was up by 3 this week with the addition of two Gulf of Mexico rigs in the state’s offshore waters, and another rig in the northwestern part of the state, which accounts for the third rig added in the Haynesville shale . . . the rig added in Alaska was drilling for oil on the North Slope, as are all other Alaskan rigs, while two rigs were added in the Marcellus, one of which was drilling for natural gas in Pennsylvania, while the other was . . . drilling horizontally for oil in Wetzel county, West Virginia, in the first Marcellus oil well since April 17, 2015at the same time, two of this week’s Haynesville rig additions were also targeting oil, bringing the Haynesville oil rig count up to four, the most oil rigs in that natural gas basin since November 1, 2013 . . . but on the other hand, one of the Eagle Ford rig additions was targeting natural gas, which at 7 gas rigs now has the largest natural gas rig deployment since November 15 2019…the national natural gas rig additions finish at two, however, because there was also a natural gas rig pulled out of a basin that Baker Hughes doesn’t track, possibly from Texas Oil District 1…
NB: the title of this part should have been:
largest jump in drilling rigs since April 1st as the Haynesville and the Marcellus are targeted for oil
that it wasn’t was all my fault; i was too busy bitching about digging out from under 15 inches of snow to give run a title other than my blog post title, which covers everything i had on oil & gas for the week….the title above that’s on this post refers to this earlier post at AB, which includes all the details that this post’s title refers to..
(Be that as it may) I’m a bit taken aback. It’s taken a moment or so to make the connection (it is early), but I just don’t think I ever expected to see a headline quite like that.
i imagine i never thought i’d write such a headline either, Ten Bears, as i’ve covered the weekly EIA petroleum status reports since 2014 and through most of that period i was writing headlines about record supplies….even as recently as April 2020, there was such an oil glut in the middle of the US that prices briefly fell to minus $40; they couldn’t give it away…
but i just report the data that the EIA publishes, and as i said in my previous note, that’s in an earlier post here at AB, with quite a similar headline: Petroleum Reserve at a new 19 Yr Low, Commercial Oil Inv. at 45 month low, total US Oil lowest since January 2012 – that post links to all the EIA spreadsheets, which include the weekly data for each metric for as long as they’ve kept weekly records…
data for the week ending the 14th was released today, delayed by the monday holiday…my opening line for this week’s report will be “US oil data from the US Energy Information Administration for the week ending January 14th indicated that due to a a big jump in our oil imports and a moderate withdrawal of crude from our Strategic Petroleum Reserve, we had enough oil left to add to our stored commercial crude supplies for the first time in 8 weeks and for the 11th time in the past thirty-four weeks…”
the SPR withdrawal was more than twice the commercial inventory build, so total US crude supplies fell to a new 10 year low nonetheless…
gasoline demand recovered a bit this week, but remained mired at an 11 month low over the last 3 weeks…at the same time, US gasoline exports fell to an 85 month low, even as they aren’t usually much of a factor in the larger scheme…but this week their drop also added to gasoline inventories, which over the past three weeks have grown by more than any other 3 consecutive weeks on record….the 3 week growth of gasoline inventories ending January 14th even exceeded their 4 week growth from mid-March to mid-April of 2020, midst the widespread lockdowns at the onset of the pandemic..
a correction to the above comment: exports fell to an 85 week low..