Petroleum Reserve at a new 19 Yr Low, Commercial Oil Inv. at 45 month low, total US Oil lowest since January 2012
Commenter and Blogger RJS, Focus on Fracking, Strategic Petroleum Reserve at a new 19 year low; commercial crude inventories fall to 45 month low, total oil supplies lowest since January 20th 2012; implied gasoline demand at 11 month low
The Latest US Oil Supply and Disposition Data from the EIA
US oil data from the US Energy Information Administration for the week ending January 7th indicated that despite a big drop in our oil exports, a concurrent shift of “unaccounted for crude oil” from supply to demand meant we still needed to pull oil out of our stored commercial crude supplies for the seventh week in a row and for the 23rd time in the past thirty-three weeks . . . our imports of crude oil rose by an average of 185,000 barrels per day to an average of 6,069,000 barrels per day, after falling by an average of 875,000 barrels per day during the prior week, while our exports of crude oil fell by an average of 599,000 barrels per day to an average of 1,955,000 barrels per day during the week, which together meant that our effective trade in oil worked out to a net import average of 4,114,000 barrels of per day during the week ending January 7th, 784,000 more barrels per day than the net of our imports minus our exports during the prior week . . . over the same period, production of crude oil from US wells was reportedly 100,000 barrels per day lower at 11,700,000 barrels per day, and hence our daily supply of oil from the net of our international trade in oil and from domestic well production appears to have totaled an average of 15,814,000 barrels per day during the cited reporting week…
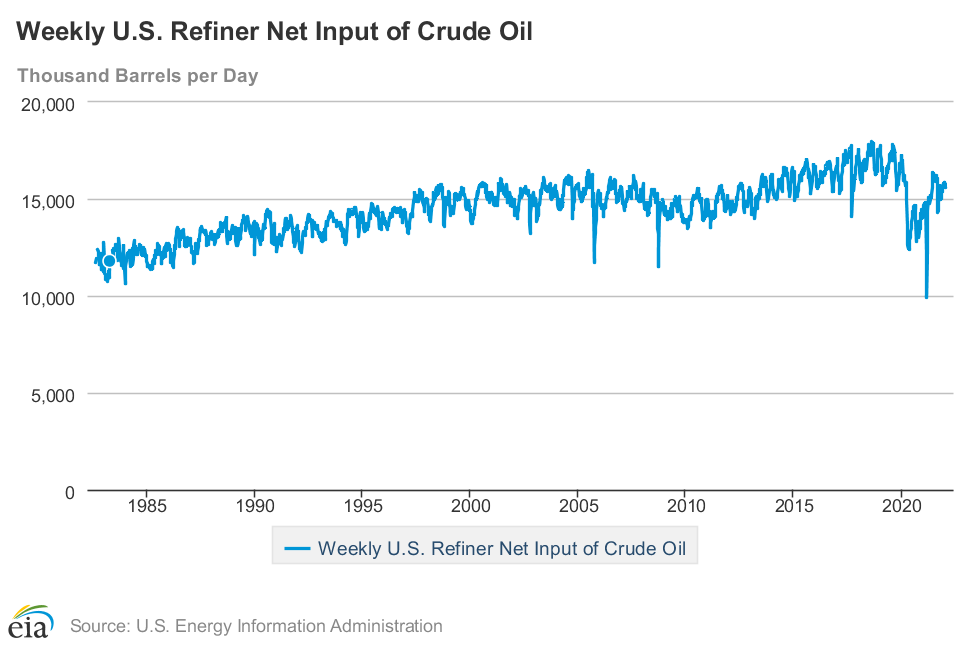
Meanwhile, US oil refineries reported they were processing an average of 15,573,000 barrels of crude per day during the week ending January 7th, an average of 293,000 fewer barrels per day than the amount of oil that our refineries processed during the prior week, while over the same period the EIA’s surveys indicated that a net of 693,000 barrels of oil per day were being pulled out the supplies of oil stored in the US . . . so based on that reported & estimated data, this week’s crude oil figures from the EIA appear to indicate that our total working supply of oil from net imports, from storage, and from oilfield production was 934,000 barrels per day more than what our oil refineries reported they used during the week . . . to account for that disparity between the apparent supply of oil and the apparent disposition of it, the EIA just inserted a (-934,000) barrel per day figure onto line 13 of the weekly U.S. Petroleum Balance Sheet to make the reported data for the daily supply of oil and the consumption of it balance out, essentially a balance sheet fudge factor that they label in their footnotes as “unaccounted for crude oil”, thus suggesting there must have been a error or omission of that magnitude in this week’s oil supply & demand figures that we have just transcribed . . . moreover, since last week’s EIA fudge factor was at (+238,000) barrels per day, that means there was a 1,172,000 barrel per day difference between this week’s balance sheet error and the EIA’s crude oil balance sheet error from a week ago, and hence the week over week supply and demand changes indicated by this week’s report are meaningless . . . however, since most everyone treats these weekly EIA reports as gospel and since these figures often drive oil pricing, and hence decisions to drill or complete oil wells, we’ll continue to report this data just as it’s published, and just as it’s watched & believed to be reasonably accurate by most everyone in the industry…(for more on how this weekly oil data is gathered, and the possible reasons for that “unaccounted for” oil, see this EIA explainer)….
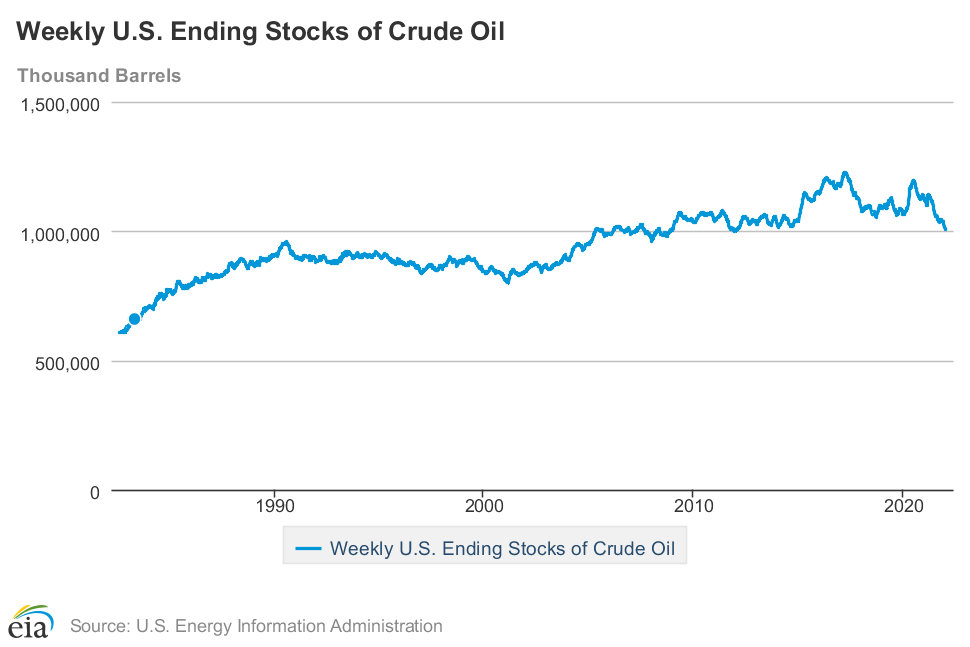
This week’s 693,000 barrel per day decrease in our overall crude oil inventories left our total supplies at 1,006,680,000 barrels, the lowest level since January 20th 2012, or nearly at a 10 year low . . . this week’s oil inventory decrease came as 650,000 barrels per day were being pulled out of our commercially available stocks of crude oil, while 43,000 barrels per day of oil were pulled out of our Strategic Petroleum Reserve, part of the first installment from Biden’s plan to release 50 million barrels from the SPR, in order to incentive continued use of US gas guzzlers . . . including the drawdowns from the Strategic Petroleum Reserve under such politically motivated programs, a total of 57,937,000 barrels have been removed from the Strategic Petroleum Reserve over the past 18 months, and as a result the amount of oil in our Strategic Petroleum Reserve has fallen to the lowest since November 15th, 2002, or to an 19 year low of 593,382,000 barrels per day, as repeated tapping of our emergency supplies for political expediency or to “pay for” other programs had already drained those supplies over the past dozen years…based on an estimated pre-pandemic consumption level of 18 million barrels per day, the US will have roughly 30 1/2 days of oil supply left in the Strategic Petroleum Reserve when the Biden program is complete…
Further details from the weekly Petroleum Status Report (pdf) indicate that the 4 week average of our oil imports fell to an average of 6,227,000 barrels per day last week, which was still 10.7% more than the 5,625,000 barrel per day average that we were importing over the same four-week period last year . . . this week’s crude oil production was reported to be 100,000 barrels per day lower at 11,700,000 barrels per day because the EIA’s rounded estimate of the output from wells in the lower 48 states was 100,000 barrels per day lower at 11,300,000 barrels per day, while Alaska’s oil production was 1,000 barrels per day higher at 460,000 barrels per day and had no impact on the rounded national production total . . . US crude oil production had reached a pre-pandemic high of 13,100,000 barrels per day during the week ending March 13th 2020, so this week’s reported oil production figure was 10.7% below that of our pre-pandemic production peak, but 38.8% above the interim low of 8,428,000 barrels per day that US oil production had fallen to during the last week of June of 2016…
US oil refineries were operating at 88.4% of their capacity while using those 15,573,000 barrels of crude per day during the week ending January 7th, down from a utilization rate of 89.8% the prior week, and lower than the historical utilization rate for early January refinery operations…the 15,867,000 barrels per day of oil that were refined this week were 8.3% more barrels than the 14,376,000 barrels of crude that were being processed daily during the pandemic impacted week ending January 8th of 2021, but 8.2% less than the 16,973,000 barrels of crude that were being processed daily during the week ending January 10th, 2020, when US refineries were operating at what was then a more seasonal 92.2% of capacity…
Even with the decrease in oil being refined this week, gasoline output from our refineries was a bit higher, increasing by 68,000 barrels per day to 8,574,000 barrels per day during the week ending January 7th, after our gasoline output had decreased by 1,607,000 barrels per day over the prior week . . . this week’s gasoline production was 14.1% more than the anomalously low 7,512,000 barrels of gasoline that were being produced daily over the same week of last year, but 7.6% less than the gasoline production of 9,281,000 barrels per day during the week ending January 10th, 2020 . . . on the other hand, our refineries’ production of distillate fuels (diesel fuel and heat oil) decreased by 177,000 barrels per day to 4,788,000 barrels per day, after our distillates output had increased by 30,000 barrels per day over the prior week . . . even after that decrease, our distillates output was still 2.7% more than the 4,661,000 barrels of distillates that were being produced daily during the week ending January 8th of 2021, but 8.0% less than the 5,205,000 barrels of distillates that were being produced daily during the week ending January 10th, 2020…
Even with our gasoline production remaining at depressed levels, our supplies of gasoline in storage at the end of the week rose for the fifth time in seven weeks, after falling each week over the preceding six weeks, increasing by 7,961,000 barrels to 240,748,000 barrels during the week ending January 7th,after our gasoline inventories had increased by 10,128,000 barrels over the prior week . . . our gasoline supplies increased again this week because the amount of gasoline supplied to US users decreased by 266,000 barrels per day to 7,906,000 barrels per day, the lowest level of implied gasoline demand in 11 months, while our imports of gasoline fell by 7,000 barrels per day to 589,000 barrels per day and our exports of gasoline rose by 56,000 barrels per day to 526,000 barrels per day…even after this week’s big inventory increase, our gasoline supplies were still 1.9% lower than last January 8th’s gasoline inventories of 245,476,000 barrels, and about 3% below the five year average of our gasoline supplies for this time of the year…
Likewise, even with the decrease in our distillates production, our supplies of distillate fuels increased for the seventh time in twenty weeks, rising by 2,537,000 barrels to 129,383,000 barrels during the week ending January 7th, after our distillates supplies had increased by 4,418,000 barrels during the prior week . . . our distillates supplies rose again this week as the amount of distillates supplied to US markets, an indicator of our domestic demand, rose by 10,000 barrels per day to 3,749,000 barrels per day, and as our exports of distillatesrose by 81,000 barrels per day to 892,000 barrels per day, and as our imports of distillates fell by 1,000 barrels per day to 216,000 barrels per day . . . but after twenty-six inventory decreases over the past forty weeks, our distillate supplies at the end of the week were still 20.7% below the 163,205,000 barrels of distillates that we had in storage on January 8th of 2021, and about 15% below the five year average of distillates inventories for this time of the year…
Meanwhile, even with the big drop in our oil exports, our commercial supplies of crude oil in storage fell for the 16th time in 23 weeks and for the 34th time in the past year, decreasing by 4,553,000 barrels over the week, from 417,851,000 barrels on December 31st to 413,298,000 barrels on January 7th, leaving our commercial crude supplies at the lowest level since October 5th, 2018, after they had decreased by 2,144,000 barrels over the prior week . . . with this week’s decrease, our commercial crude oil inventories remained about 8% below the most recent five – year average of crude oil supplies for this time of year, but were still around 27% above the average of our crude oil stocks as of the first week of January over the 5 years at the beginning of the past decade, with the disparity between those comparisons arising because it wasn’t until early 2015 that our oil inventories first topped 400 million barrels . . . since our crude oil inventories had jumped to record highs during the Covid lockdowns of last spring and remained elevated for most of the year after that, our commercial crude oil supplies as of this January 7th were 14.3% less than the 482,211,000 barrels of oil we had in commercial storage on January 8th of 2021, and are now 3.6% less than the 428,511,000 barrels of oil that we had in storage on January 10th of 2020, and also 5.4% less than the 437,055,000 barrels of oil we had in commercial storage on January 11th of 2018…
Finally, with our inventory of crude oil and our supplies of all products made from oil all near multi year lows, we are continuing to track the total of all U.S. Stocks of Crude Oil and Petroleum Products, including those in the SPR . . . the EIA’s data shows that the total of our oil and oil product inventories, including those in the Strategic Petroleum Reserve and those held by the oil industry, and including everything from gasoline and jet fuel to propane/propylene and residual fuel oil, fell by 4,782,000 barrels this week, from 1,788,433,000 barrels on December 31th to 1,783,651,000 barrels on January 7th, leaving our total inventories at the 2nd lowest level since August 29th, 2014…..
as usual, all my links to oil and oil product metrics above are to the EIA html spreadsheet for the cited metric, which include the weekly data for as long as each record has been kept, as well as an interactive graphs of that history that one can scroll across to have that same data appear in a small adjacent popup box over or alongside of the cited graph..
Obviously, now would not be a good time to begin replenishing the strategic oil reserve, prices being what they are. Unless that billionaire’s surtax is instituted posthaste. One purpose could certainly be to give Big Oil some fresh revenue. They’d no doubt appreciate it.