Retail Sales Up 1.7% in October, August and September Revised Higher
MarketWatch 666 Blogger RJS on the macroeconomic implications of retail sales, estimates the impact of retail sales on GDP.
Retail Sales Rose 1.7% in October after August & September Sales Were Revised Higher
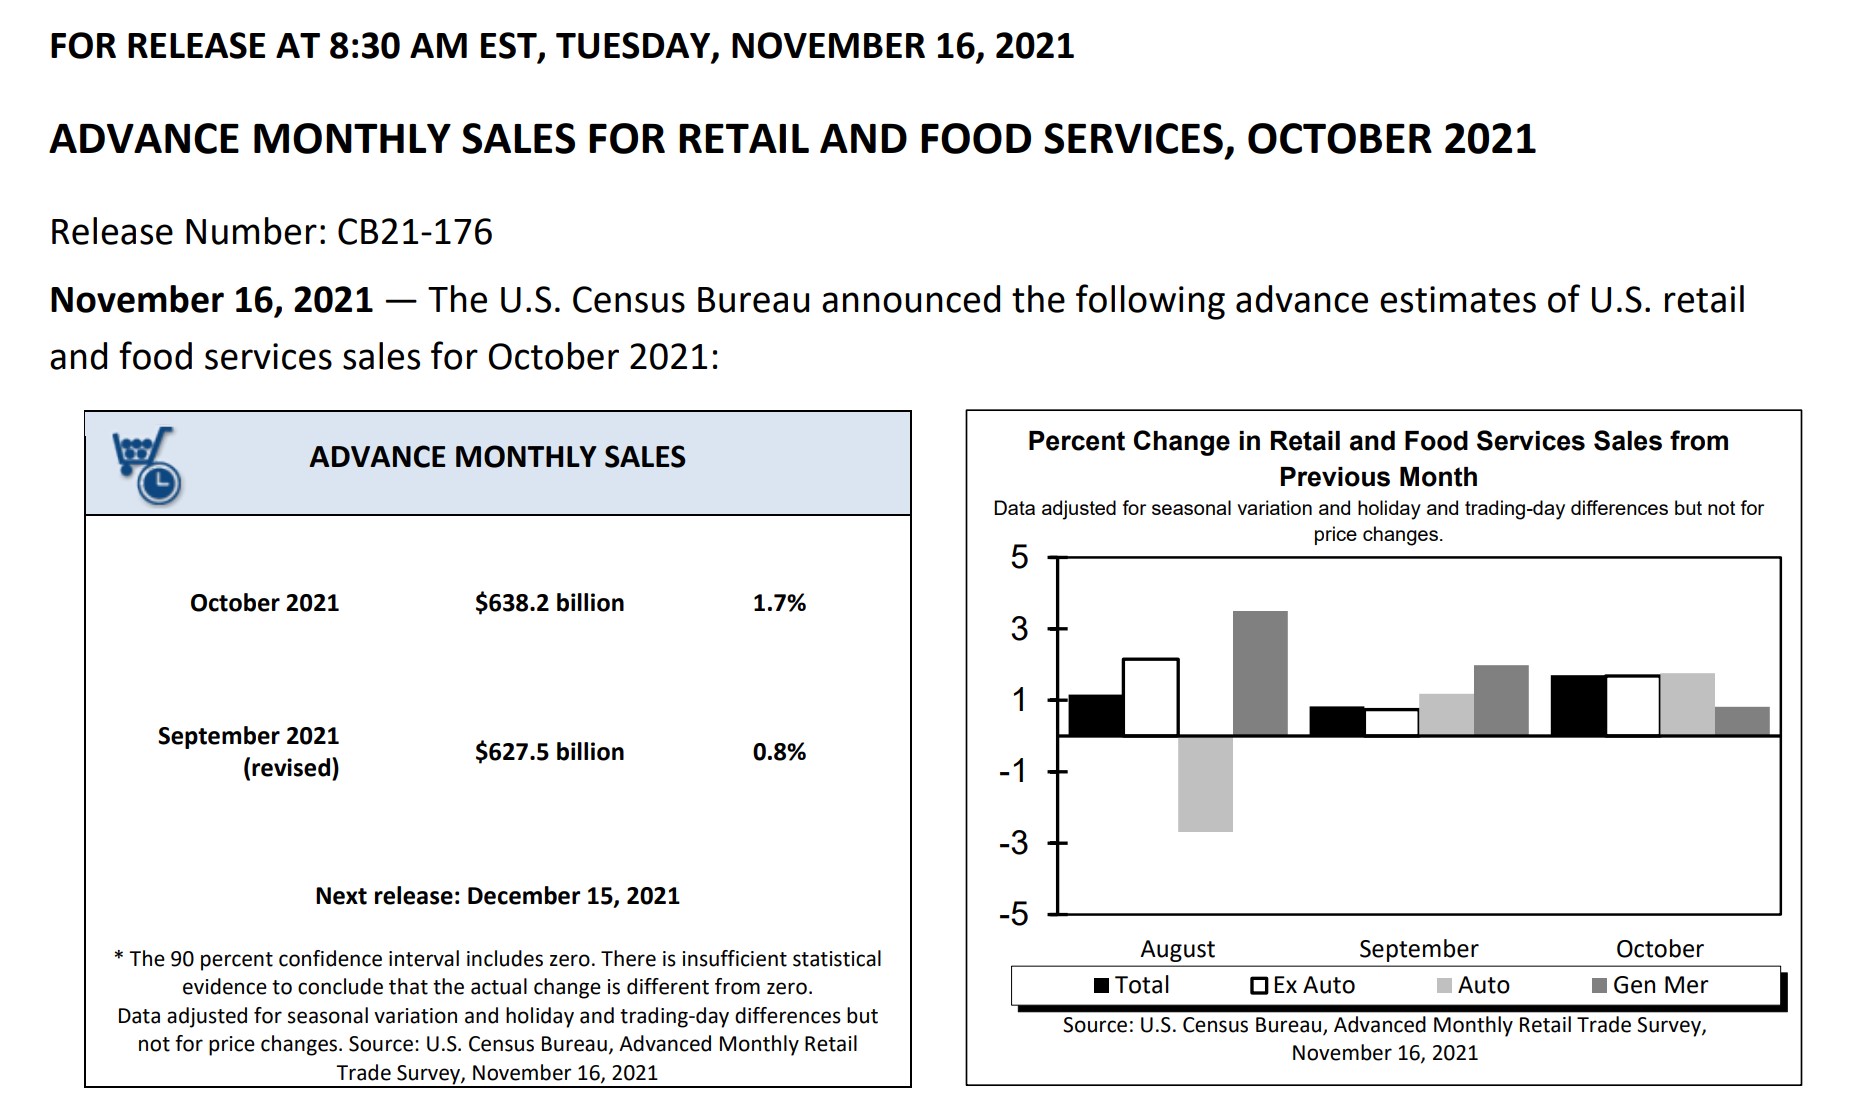
Seasonally adjusted retail sales increased 1.7% in October after retail sales for August and September were revised higher…the Advance Retail Sales Report for October (pdf) from the Census Bureau estimated that seasonally adjusted retail and food services sales totaled $638.2 billion during the month, which was 1.7 percent (±0.5%) higher than September’s revised sales of $627.5 billion and 16.3 percent (±0.9 percent) above the seasonally adjusted sales in October of last year . . . September’s adjusted sales were revised from the $625.4 billion reported last month to $627.5 billion, while August’s sales were revised from $620.9 billion to $622.4 billion, and the combination of those two upward revisions caused the August to September percent increase to rise from up 0.7 percent (±0.5 percent) to up 0.8 percent (±0.2 percent) . . . estimated unadjusted sales, extrapolated from surveys of a small sampling of retailers, indicated sales actually rose 4.3%, from $608,462 million in September to $634,596 million in October, while they were up 14.7% from the $553,114 million of sales in October a year ago . . . the total $3.6 billion upward revision to August and September’s retail sales would indicate an upward revision of around $14.4 billion at an annual rate in 3rd quarter sales, and should increase the previous estimate of the personal consumption expenditures contribution to 3rd quarter GDP by about 0.24 percentage points, assuming the distribution of price adjustments in the revised figures is similar to that of those originally published…
Included below is the table of the monthly and yearly percentage changes in retail sales by business type taken from the October Census Marts pdf . . . the first double column below gives us the seasonally adjusted percentage change in sales for each kind of business from the September revised figure to this month’s October “advance” report in the first sub-column, and then the year over year percentage sales change since last October in the 2nd column . . . the second double column pair below gives us the revision of the September advance estimates (now called “preliminary”) as of this report, with the new August to September percentage change under “Aug 2021 r” (revised) and the September 2020 to September 2021 percentage change as revised in the last column shown…for your reference, the table of last month’s advance estimate of September sales, before this month’s revisions, is here…
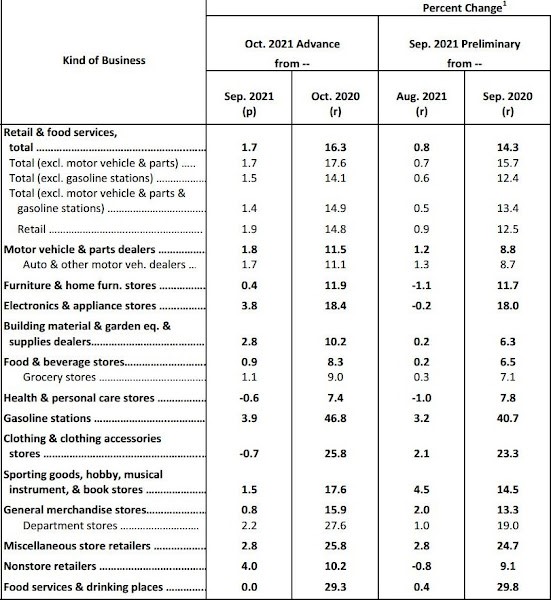
To compute October’s real personal consumption of goods data for national accounts from this October retail sales report, the BEA will use the corresponding price changes for each type of sales from the October consumer price index, which we reviewed last week . . . to estimate what they will find, we’ll start by pulling out the usually volatile sales of gasoline from the other totals…from the third line on the above table, we can see that October retail sales excluding the 3.9% increase in sales at gas stations were up by 1.5% . . . then, subtracting the figures representing the 0.9% increase in grocery & beverage sales and the unchanged food services sales from that total, we find that core retail sales were up by roughly 1.85% for the month . . . since the CPI report showed that the composite price index for all goods less food and energy goods was up 1.04% in October, we can thus approximate that real retail sales excluding food and energy were on average about 0.8% higher for the month . . . however, the actual adjustment for each of the types of sales shown above will vary by the change in the related price index . . . for instance, while nominal sales at sporting goods, hobby, music and book stores rose 1.5%, the price index for recreational commodities rose 0.4%, so real sales of recreational goods were only up around 1.1% . . . similarly, while nominal sales at motor vehicle & parts dealers were up by 1.8%, the price index for transportation commodities other than fuel was 1.9% higher, which would mean that real unit sales at auto & parts dealers would actually be around 0.1% lower…likewise, while sales at furniture stores were up 0.4%, the price index for household furnishings and supplies increased by 0.8%, which would suggest that real sales at furniture stores actually fell by around 0.4% . . . at the same time, while sales at clothing stores were 0.7% lower in October, the apparel price index was unchanged, which would mean that real sales of clothing actually fell.0.7%…..
In addition to figuring those core retail sales, to make a complete estimate of real October’ PCE for goods, we’ll need to adjust food and energy retail sales for their price changes separately, just as the BEA will do….the CPI report showed that the food price index was 0.9% higher in October, with the price index for food purchased for use at home 1.2% higher, while prices for food bought to eat away from home were 0.8% higher . . . hence, even with nominal sales at food and beverage stores 0.9% higher, real sales of food and beverages would this be roughly 0.3% lower in light of the 1.2% higher prices . . . likewise, nominal sales at bars and restaurants, once adjusted for 0.8% higher prices, suggests that real sales at bars and restaurants fell 0.8% . . . meanwhile, while nominal sales at gas stations were up 3.9%, there was a 6.1% increase in the retail price of gasoline, which would suggest real sales of gasoline were on the order of 2.1% lower, with the caveat that gasoline stations do sell more than gasoline, and we aren’t accounting for those other sales…by reweighing and averaging the real sales changes that we have thus estimated back together, and excluding food services, we can estimate that the income and outlays report for October will show that real personal consumption of goods rose by almost 0.5% for the month, after rising by a revised 0.4% in September, and by a revised 1.2% in August, but after falling by 2.4% in July, and rising by 0.4% in June, but after falling by 2.6% in May, and after falling by 0.4% in April, but after rising by 10.0% in March, falling by 3.3% in February and rising by 7.2% in January…..at the same time, the 0.8% decrease in real sales at bars and restaurants will have a negative impact of about half of 0.1% on October’s real personal consumption of services..
Given that we now have estimates of the relative change in real personal consumption of goods for October and each of the third quarter months, we can also make a very tentative estimate on how October’s retail sales will impact 4th quarter GDP . . . we do that by setting October’s real PCE goods as an index equal to 100, which means September’s real PCE goods would be equal to 99.5, (ie, 100-0.5%), that August’s PCE goods would be equal to 99.1 (99.5-0.4%), and that July’s PCE goods would be equal to 97.9 (99.1 – 1.2%) . . . we then compute the quarter over quarter change in those index values at a quarterly rate to determine the change that would be applied to 4th quarter GDP from October’s real sales increase . . . (((100 / ((99.5 + 99.1 +97.9) /3)) ^4 = 1.04806, which means that October’s real PCE goods are rising at a 4.8% annual rate over the the third quarter . . . since one month’s PCE goods is roughly 8.3% of GDP, that suggests that October’s PCE goods will add roughly 0.40 percentage points to 4th quarter GDP….that would also mean that even if real retail shows no improvement over November and December, PCE goods would still add roughly 1.20 percentage points to 4th quarter GDP….
Stocks fail to sustain gains after President Biden says Jerome Powell will stay atop the Fed
NY Times: Stocks closed down on Monday, as a late-day slide undid early gains that followed President Biden’s decision to renominate renominated Jerome H. Powell for another four-year term as chair of the Federal Reserve.
The announcement that Mr. Powell would remain at the helm of the central bank — whose monetary policy has been a key driver of the market’s remarkable run over the past two years — had appeared to comfort investors for much of the day, as the S&P 500 briefly touched record levels. …
But yields on government bonds ticked higher as the day went on, driven in part by expectations that a Fed led by Mr. Powell will ultimately respond to higher inflation by more aggressively raising interest rates.
The rising yields eventually turned what had been a rally into a sudden sell-off. After being up nearly 1 percent in early trading, the S&P 500 closed down 0.3 percent.
Technology shares with high prices compared with the profits the companies are expected to earn over the next year — which are especially sensitive to movements in interest rates — got clobbered. The cloud technology providers Zscaler, Datadog and Fastly fell more than 6 percent.
Tech giants including Amazon and Alphabet — two companies with valuations well over $1 trillion that have significant sway in market indexes — were hit hard, helping push the tech-heavy Nasdaq composite down 1.3 percent. Amazon was down 2.8 percent and Alphabet, Google’s parent company, was down more than 1.5 percent.
Technology stocks are especially sensitive to rises in long-term Treasury bond yields, which move opposite bond prices. Those higher (and nearly guaranteed) returns on government debt offer an attractive option to investors, siphoning money out of the stock market — which is exactly what happened after Monday’s announcement. …
Who is Lael Brainard, President Biden’s pick for the Fed’s vice chair?
Behind the Powell pick: a bet the economy has room to grow and inflation will fade