New home sales for October continue slow upward trend
New home sales for October continue slow upward trend
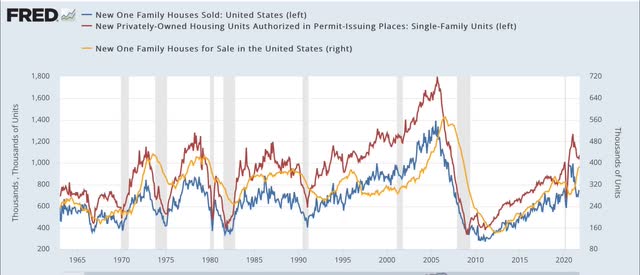
New home sales, while very noisy and heavily revised, tend to lead all of the other housing indicators, even permits. The heavy revisions figure, well, heavily, into this morning’s report. New home sales (blue in the graphs below) usually slightly lead to the much less volatile single-family home permits (red). The number of houses for sale (gold) lags consistently. Here is the long term view:
In October, new home sales rose less than 1% from a 5%+ downward revision to last month’s report. But August was revised higher. As the graph suggests, the net result is a moderate increase from the summer’s low. Last month I wrote that the increase in new home sales would probably translate into an increase in single-family permits, which did occur. Meanwhile, the number of houses for sale increased slightly to the highest level in 10 years, and is probably peaking:
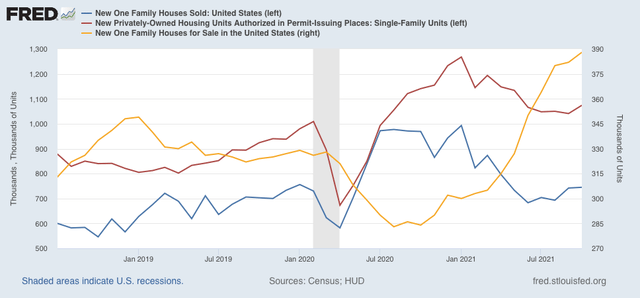
Mortgage rates have fluctuated in a tight range for the past 5 months, so I expect the slow increase in new houses sold and under construction to continue.
Both of this morning’s reports on long leading indicators (housing and corporate profits) point towards a cooling of the economy next year, but no actual downturn.
just to clarify the revisions that came with this month’s report:
revisions like that are why i’ve never spent a lot of time with this report….it’s not really Census’s fault; Congress mandates that this data be collected, and doesn’t fund it..