Jobs, Trade Deficit, Construction Spend, and Factory Inventory Reports
MarketWatch 666: Commenter and Blogger RJS; October’s jobs report; September’s trade deficit, construction spending, and factory inventories, et al
Major economic reports that were released the past week included the Employment Situation Summary for October from the Bureau of Labor Statistics, and three September reports that included metrics which were either estimated or included in last week’s release of 3rd quarter GDP: the Commerce Dept report on our International Trade for September, and the September report on Construction Spending (pdf) and the Full Report on Manufacturers’ Shipments, Inventories and Orders for September, both from the Census Bureau…in addition, the Fed released the Consumer Credit Report for September, which indicated that overall consumer credit, a measurement of non-real estate debt, grew by a seasonally adjusted $22.9 billion in September, or at a 8.3% annual rate, as non-revolving credit expanded at a 7.2% rate to $3,357.0 billion, while revolving credit outstanding grew at a 11.8% rate to $1,010.4 billion…
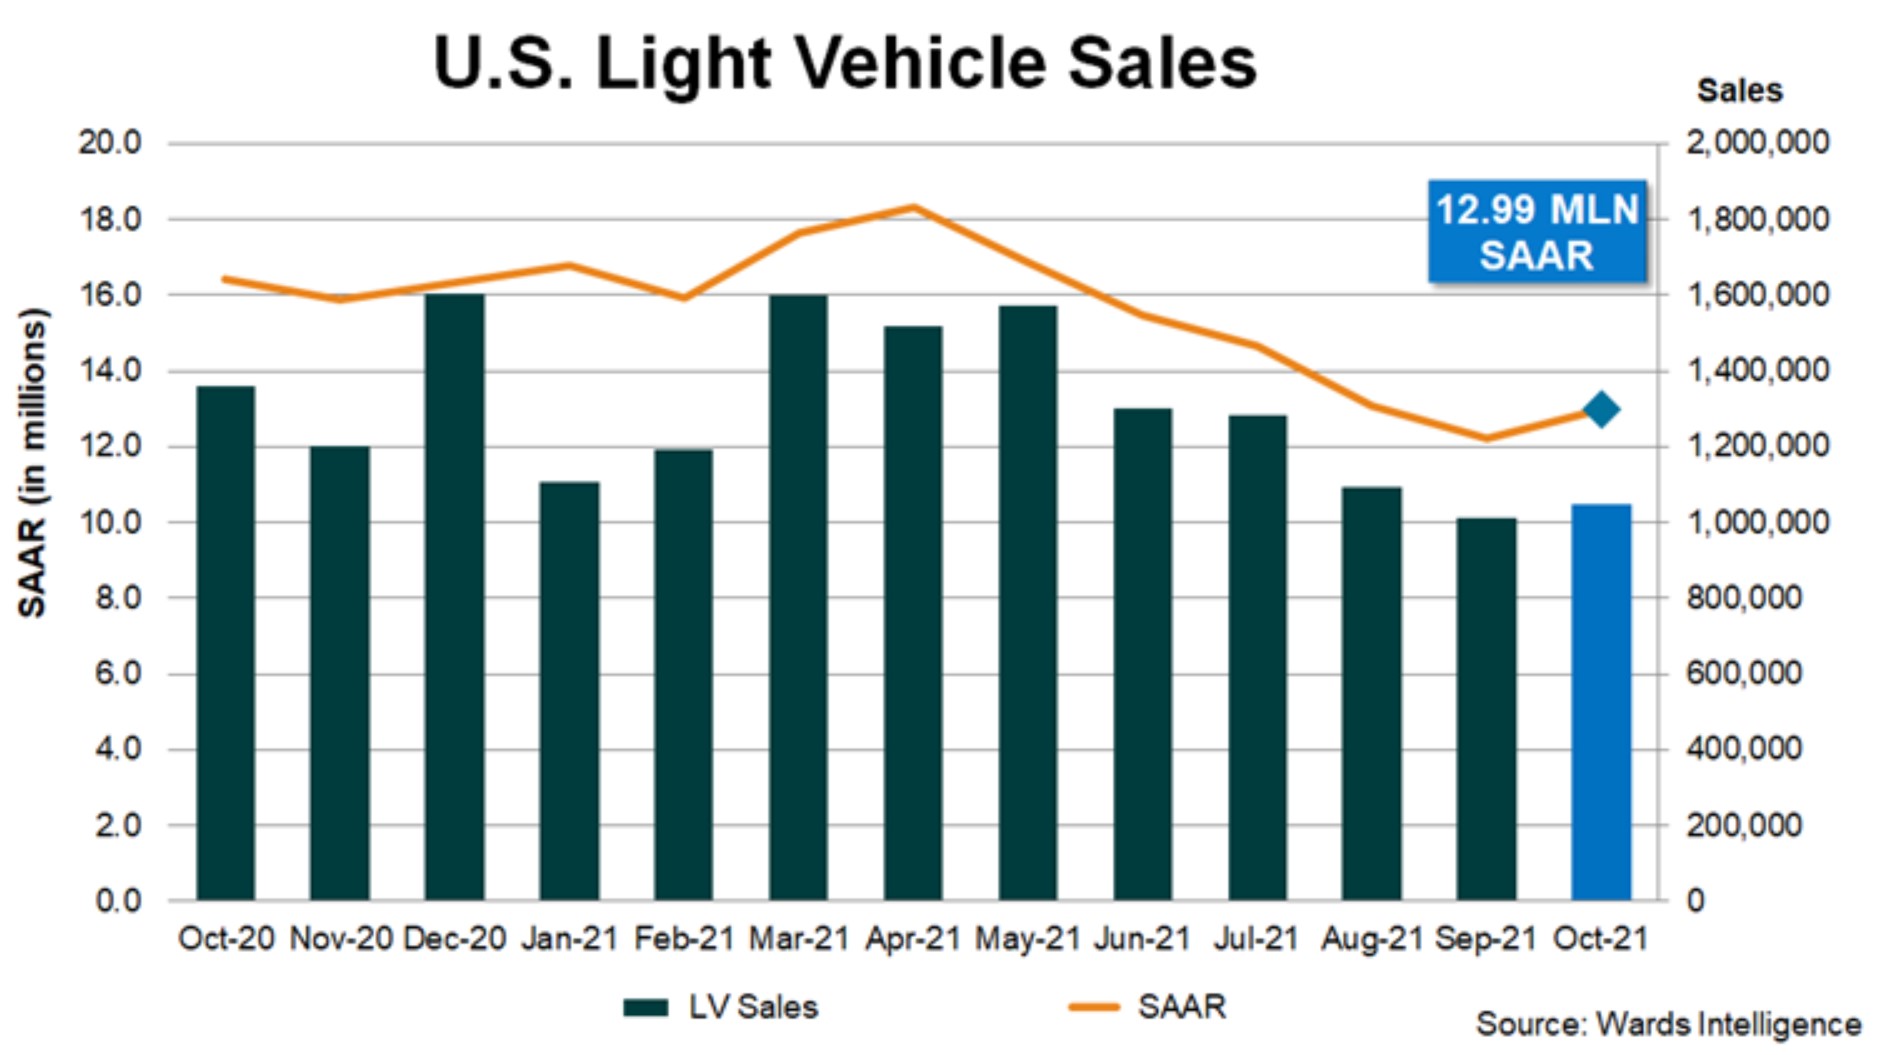
Privately issued reports included the ADP Employment Report for October, which indicated an increase of 571,000 private sector jobs, the light vehicle sales report for October from Wards Automotive, which estimated that vehicles sold at a 12.99 million annual rate in October, up from the 12.18 million annual sales rate reported for September, but down from the 16.21 million annual sales rate of a year ago, and both of the widely followed purchasing manager’s surveys from the Institute for Supply Management (ISM): the October Manufacturing Report On Business indicated that the manufacturing PMI (Purchasing Managers Index) slipped to 60.8% in October, down from 61.1% in September, which indicates a slightly smaller plurality of manufacturing purchasing managers reported expansion in various facets of their business in October than a month earlier, and the October 2021 Services Report On Business, which saw their Services PMI rise to a record 66.7%, up from 61.9% in September, indicating a larger majority of service industry purchasing managers reported growth in various facets of their business in October than ever before…
To grasp what that record high Services PMI means, you should understand that the PMIs, and all other such diffusion indices that i know of, are derived from a survey of purchasing managers or other executives who are in a position to know the details of a business’s condition . . . once a month, those execs are queried as to their company’s production, new orders, employment and several other business metrics, with their possible responses simplified to “getting better”, “getting worse”, or “about the same” . . . responses from those executives indicating improvement at their company add 1 to the index; those that respond conditions are about the same as the prior month add 0.5, and those indicating weaker business conditions add 0 . . . the diffusion index is then constructed by multiplying the resulting total by 100 and dividing that by the number of responses . . . there is no query as to the degree that conditions might be getting better or getting worse . . . hence, the response from a company that might be doing much better would be offset by one doing just slightly worse…furthermore, there is no weighting of the size of the companies whose purchasing managers are members of the Institute for Supply Management; the response from Ford Motor’s purchasing manager, for instance, counts the same as the response from the purchasing manager of Podunk Tiddlywinks…hence we might have a strongly positive PMI if several tiddlywinks companies had a little bit better month in October than they did in September, even if Ford and GM were doing much worse . . . however, since the PMIs are released well in advance of the hard data collected by government agencies for the month, they are probably still useful as an advance indicator of industry sentiment, and possibly might indicate which direction the actual data for the month might turn . . . but other than that, they’re really no more indicative of the hard data than a consumer confidence survey is of retail sales…
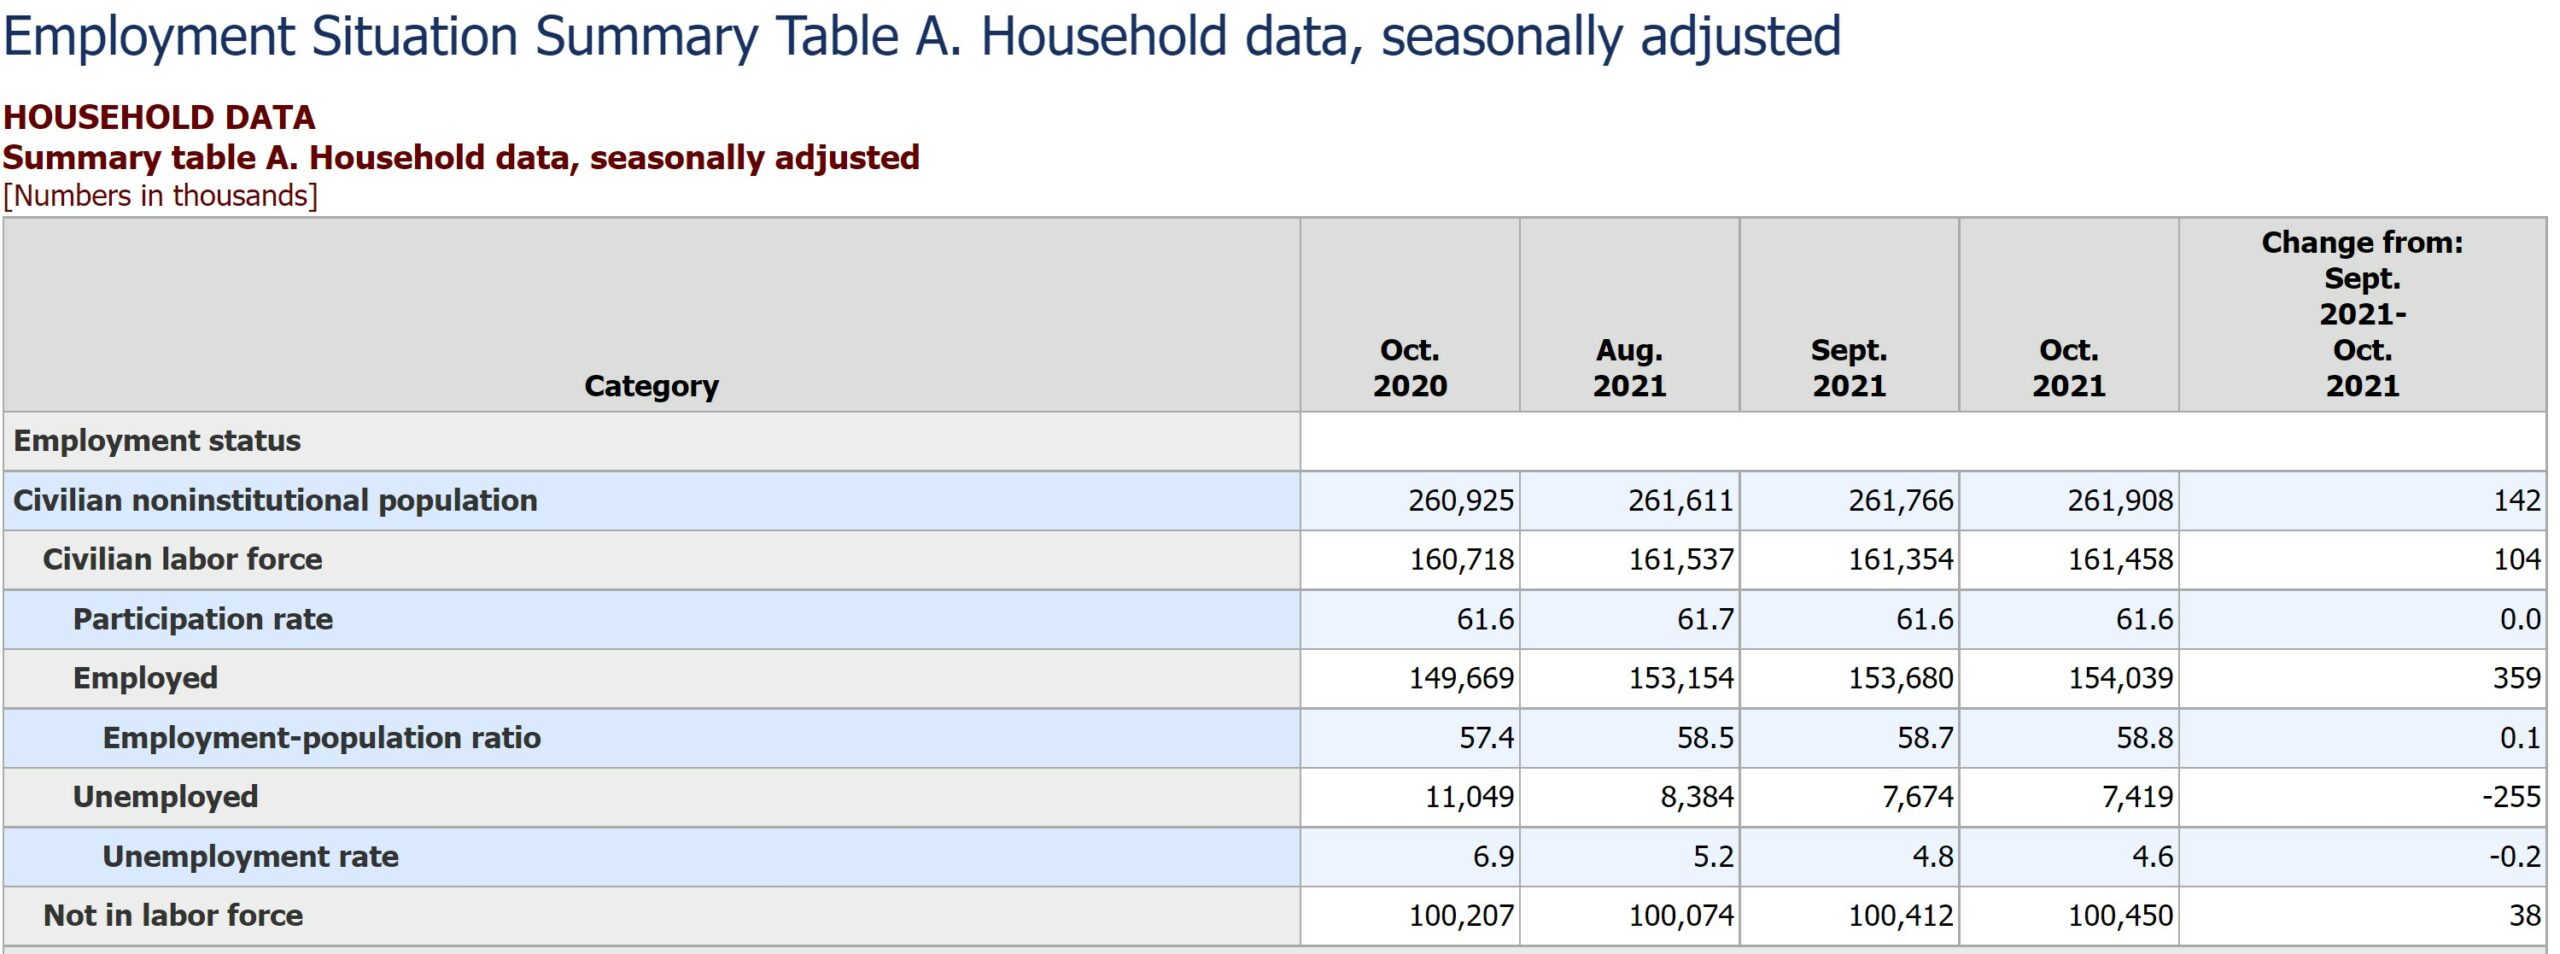
Employers Add 638,000 Jobs in October, Unemployment Rate Falls to 6.9%
The Employment Situation Summary for October indicated the greatest growth in payroll jobs since the Delta Covid wave hit, and that the unemployment rate fell by 0.2% to 4.6%, while the employment rate rose by 0.1% to 58.8% . . . .estimates extrapolated from the seasonally adjusted establishment survey data projected that employers added 531,000 jobs in October, after the previously estimated payroll job change for September was revised from an increase of 194,000 jobs to one of 312,000, while the payroll jobs increase for August was also revised higher, from 366,000 to 483,000 . . . combined with October’s increase, those revisions means that this report shows a total of 748,000 more payroll jobs than last months report….however, even with that solid job gain, October’s non-farm payrolls still remained 4,204,000 jobs below the 152,523,000 seasonally adjusted jobs that are now indicated for February 2020 . . . mean- while, the unadjusted data shows that there were actually 1,558,000 more payroll jobs extent in October than in September, as the normal seasonal job increases in the education and retail sectors were washed out of the headline number by the seasonal adjustment…
Seasonally adjusted job increases in October were seen throughout the private goods producing and service sectors, with only the government sector seeing job losses totaling 73,000, which included 21,500 in state education and 43,400 in local education, which both actually reflect hiring increases that were below the seasonal norm . . . October’s largest job increase was in the leisure and hospitality sector, which gained 164,000 jobs, anchored by 119,400 additional jobs in bars and restaurants and 23,200 additional jobs in accommodation . . . the broad professional and business services sector saw the addition of 100,000 jobs, with 41,100 more employed by temporary employment agencies, and 13,600 new jobs with management and technical consulting services . . . meanwhile, employment in manufacturing increased by 60,000, with 27,700 of those working in motor vehicles and parts factories and 5,800 more involved in the manufacture of fabricated metal products . . . in addition, the transportation and warehousing sector added 54.400 jobs, including 15,800 more employed in transit and ground passenger transportation and 20,200 more working in warehousing and storage facilities . . . at the same time, construction employment rose by 44,000, including 19,300 jobs with nonresidential specialty trade contractors and 12,100 more employed by heavy and civil engineering construction contractors . . . October also saw the addition of 37,200 jobs in health care, with 15,800 of those employed by home health care services and 8,600 more working in doctor’s offices….the retail sector saw an increase of 35,300 more jobs than is normal for the season, with 15,800 workers hired by food and beverage stores and 15,300 more hired by general merchandise stores . . . meanwhile, “other” services accounted for 33,000 more of the month’s jobs with the hiring of 28,100 more workers by personal and laundry services….in addition, employment in financial activities rose by 21,000, with 12,400 more working in real estate and rental and leasing and 11,200 working in securities, commodity contracts, and investments . . . other October job additions included 17,000 in private education, 13,500 jobs in wholesale trade, 10,000 in information, 9,700 in social assistance, 4,000 jobs in resource extraction, and 200 more jobs with utilities…
The establishment survey also showed that average hourly pay for all employees rose by 11 cents an hour to $30.96 an hour in October, after increasing by a revised 18 cents an hour in September, and is now up 4.9% over the past year; meanwhile, the average hourly earnings of production and nonsupervisory employees increased by 10 cents an hour to $26.26 an hour . . . employers also reported that the average workweek for all private payroll employees decreased by 0.1 hour to 34.7 hours in October, while hours for production and non-supervisory personnel decreased by 0.1 hour to 34.1 hours . . . at the same time, the manufacturing workweek decreased by 0.1 hour to 40.1 hours, while average factory overtime also fell by 0.1 hour to 3.2 hours…
Meanwhile, the October household survey indicated that the seasonally adjusted extrapolation of those who would report being employed rose by an estimated 359,000 to 154,039,000, while the estimated number of those unemployed and looking for work fell by 255,000 to 7,419,000; and hence the labor force increased by a net total of 114,000 . . . since the working age population had grown by 142,000 over the same period, that meant the number of employment aged individuals who were not in the labor force rose by 38,000 to 100,450,000…meanwhile, the increase in the labor force was not enough to increase the labor force participation, as it remained at 61.6%, same as in October a year ago . . . however, the increase in number employed was enough to increase the employment to population ratio, which we could think of as an employment rate, from 58.7% in September to 58.8% in October . . . similarly, the corresponding decrease in the number unemployed was enough to cause the unemployment rate as a percentage of the labor force to decrease from 4.8% to 4.6%, which was the lowest unemployment rate since March 2020 . . . mean-while, the number of those who reported they were forced to accept just part time work fell by 45,000, from 4,468,000 in September to 4,423,000 in October, which was enough to lower the alternative measure of unemployment, U-6, which includes those “employed part time for economic reasons,” from 8.5% in September to 8.3% of the labor force in October, the lowest since February 2020, before the pandemic hit…
Like most reports from the Bureau of Labor Statistics, the employment situation press release itself is easy to read and understand, so you can get more details on these two reports from there…note that almost every paragraph in that release points to one or more of the tables that are linked to on the bottom of the release, and those tables are also on a separate html page here that you can open it along side the press release to avoid the need to scroll up and down the page..
Plans Will Slow Inflation. The Big Question Is: When?
(The chaos created by Covid over the past 18 months,
the stalemate in Congress, the January 6 insurrection,
all add up to disruption to the economy that will take
a long time to heal. Has the healing process even begun?)
Inflation is probably a natural outgrowth of the string
of catastrophes we are enduring.