Dear Democrats: Yes, inflation is a problem
Dear Democrats: Yes, inflation is a problem
[Update: I see where Larry Summers has obviously read my piece below, and says, “I agree with NDD!” (Just teasing)]
In the past few days, I have seen a spate of articles and tweets from prominent partisans and economists telling Democrats not to worry about inflation, either because it is a transient supply chain issue, or else because Biden’s infrastructure and “Building Back Better” plans will not add to it.
I dissent. I think the evidence is compelling that inflation *is* becoming a problem. Not because of Biden’s plans – which may not add to inflation – but rather because inflation in the three most important things that consumers either notice or care about – gasoline, cars, and houses – is not so transient at all. In particular, I believe that elevated inflation numbers for housing, which is over 1/3rd of the entire metric, is going to persist for at least another year.
Let me take these in order.
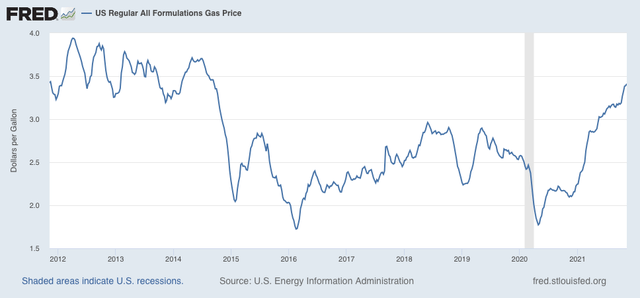
Gasoline
Noticing changes in the price at the pump is the most visible manifestation of inflation. And in the past 18 months, since just after the lockdowns ended, on average the price of gas has increased from $1.77 per gallon to $3.41 one week ago. Not only is this a near-doubling in price, but it is the highest in the past 7 years:
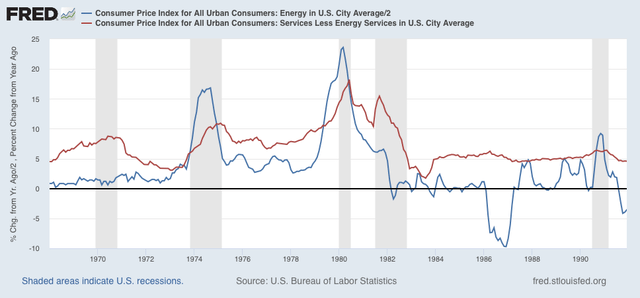
Not only that, but energy prices tend to feed through into the wider economy with a 6 to 12-month lag. This is shown in the next two graphs, which show the YoY% change in energy prices (blue) vs. the YoY% change in all other prices (red). Here are the higher inflation 1970s and 1980s:
And here is our lower inflation era beginning in 1992:
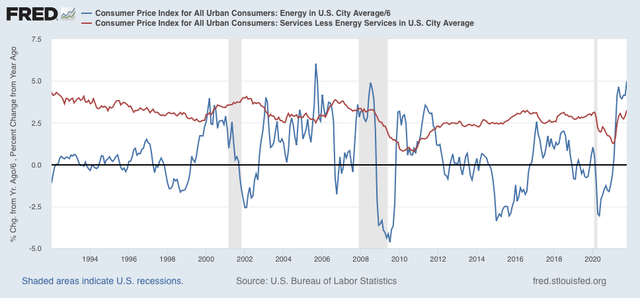
(Note that I have divided energy prices by 2 and 6, respectively, in the two graphs for scale so that the relationship is better shown).
In 1974, 1979, 1991, 1999, the mid-2000s, and 2011, a substantial increase in gas prices was followed by an increase in the overall inflation rate for everything else. It certainly appears that the same pattern is happening now.
This suggests that even if gas prices have peaked for now (quite possibly true), that inflation will continue to seep through into the overall inflation rate for the next 6 to 12 months.
Cars
Below is a graph of the YoY% change in prices since 1976 in new motor vehicles (blue) vs. the YoY% change in the number of motor vehicles (excluding commercial trucks) sold (red), averaged quarterly (note sales /10 for scale):
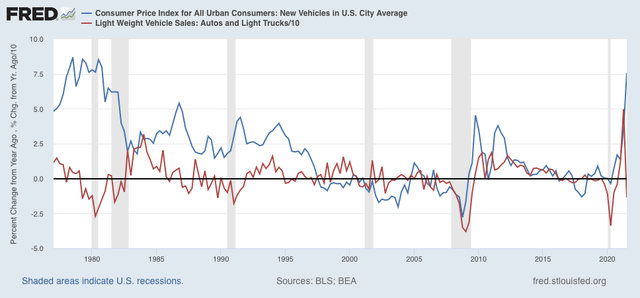
With the sole exception of the period right after the Great Recession, whenever there has been a surge in prices of new vehicles, YoY vehicle sales have turned negative.
Now here is a close-up of the past 5 years, monthly:
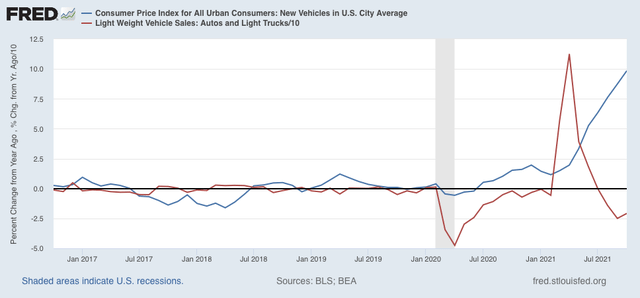
The big YoY spike in sales this spring is an artifact of the huge decline during the spring 2020 lockdowns. Since then as prices have spiraled higher, now up almost 10% in one year alone, sales have turned negative.
Houses
The pattern is similar for housing, as measured by the FHFA (dark blue) and Case Shiller (light blue) house price indexes. Big YoY changes in the price of houses, by 5% or more, have typically been followed by a decline in new houses sold as measured by building permits (red, /4 for scale) (note graph subtracts 5% for both house price indexes, so a 5% YoY increase shows as 0, better to show the relationship):
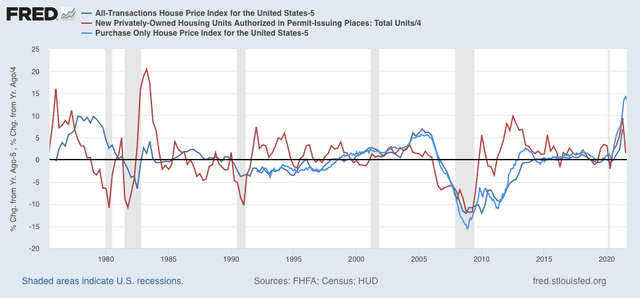
The above graph averages permit by quarter to cut down on noise. Below is the same data for the past 5 years, including monthly changes in permits:
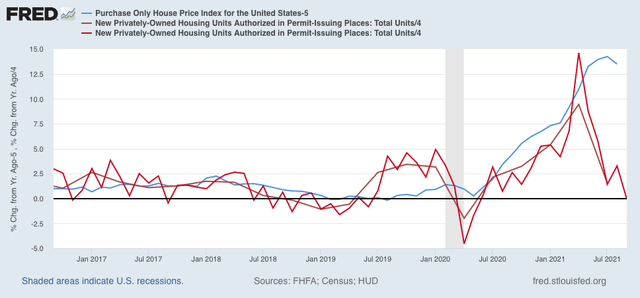
Permits are now virtually unchanged from one year ago.
Consumer reaction
Unsurprisingly, consumers have decided that now is the worst time to buy a house, car, or major household appliances since the 1980-82 recessions:
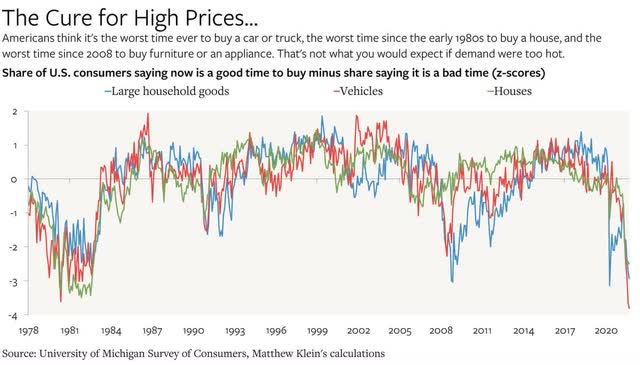
They’re not wrong, and this isn’t good for Democrats.
Further, not only are the increase in gas prices likely to seep through into wider inflation in 2022 but so is housing, due to the unusual way that housing inflation is measured. I referred to this in an article last week, but want to spell it out further.
The CPI for housing is measured by something called “owners’ equivalent rent,” or, “how much could I rent my house out for if I wanted to?” It’s bizarre, but for this post just take it as a given.
The owner’s equivalent rent (blue in the graph below) typically tracks very closely to the inflation measure for “rent of primary residence,” i.e., how much are renters paying each month? (gold):
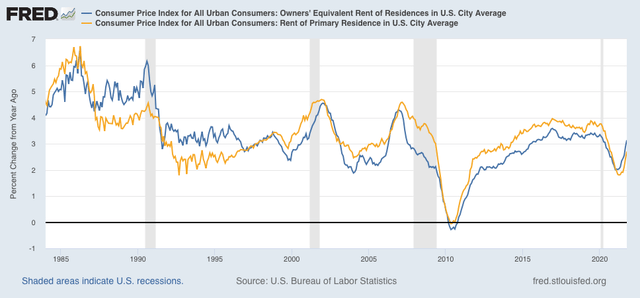
Note the big YoY increases in rent, and owners’ equivalent rent, associated with 3 of the last 4 recessions. Note also the big increase in the YoY level of each in the past 6 months.
Now here are the two house price indexes (blue and gray, /2 for scale) compared with owners’ equivalent rent (red):
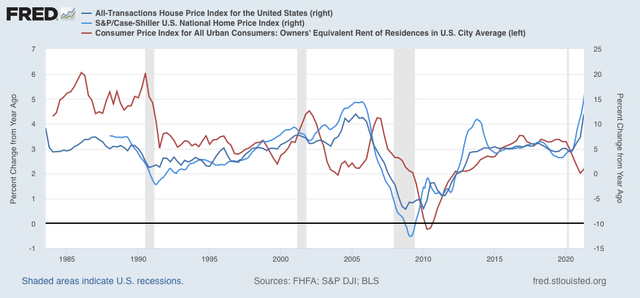
While the relationship is somewhat noisy, it does appear that big increases in house prices have correlated with big increases in owners’ equivalent rent with a lag of 12 to 24 months (bottoms in the former tend to lead bottoms in the latter by about 6 to 12 months). That’s probably because big increases in house prices drive people out of that market, and into the market for apartment rentals.
In other words, not only are higher gas prices likely to feed into higher rates of overall inflation in the next year, but “owners’ equivalent rent” also is likely to contribute elevated readings to CPI during that time frame as well.
Historically, big declines in sales of new houses and cars of over 20% have typically given rise to recessions over the past 40+ years:
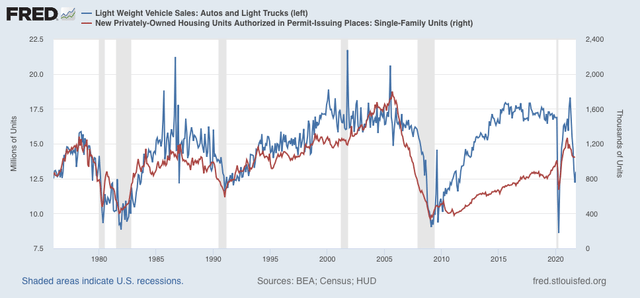
New home sales, as measured by permits, are down over 15% but not 20% at present. Car sales, however, are depressed at levels typically associated with recessions before.
Needless to say, continued inflation at rates not seen since the 1970s in 2022 is not “transitory” and is not going to be good for Democrats.
I hasten to add that my array of long and short leading indicators are not pointing to recession at this time. Interest rates and bank lending are very accommodative, and producers are still going full-tilt. The key for consumers is going to be whether they pull back in overall purchases. We will get important information about that in tomorrow’s retail sales report for October.
“…Needless to say, continued inflation at rates not seen since the 1970s in 2022 is not ‘transitory’ and is not going to be good for Democrats.
I hasten to add that my array of long and short leading indicators are not pointing to recession at this time…”
[So, what we really have is a question of “problem” for who and relative to what. If there is a down side to this problem, then it is that the payment of externalized costs are only temporary and mostly misdirected and that political alternatives to the status quo are non-existent. A globalized disposable economy suggests the whole world is disposable, but replacement costs are presently prohibitive. Smaller homes, shorter commutes, and cleaner fuels are all good, but what is the cost? For long we have had it before paying for it (externalized costs), but now we face paying for it before we have it (investment for the common good). Do not worry. Tragedy of the commons is a continuing drama.]
“…inflation in the three most important things that consumers either notice or care about – gasoline, cars, and houses – is not so transient at all…”
[Which is to say that people that cannot afford to buy a home or a car should be feeling better about their lack of prospects now :<) Of course food is a biggie too, but meat which has risen the most in price amongst food items was already too expensive for the poor and working poor beyond a little cured pork (e.g., fatback) in their pot of dried beans. This is why Republicans are jealous of the poor that are so far down that it looks like up to them. OTOH, the price of milk is trailing gas, but as of late noticeably rising, which is a problem for lower income families that either live in a shoe or live on a shoestring.
This is to say that one’s public complaints are as much a function of having the social position available to them to make their complaints known as it is of their having something substantial to complain about. OTOH, political necessity Trump’s effective policy if one counts effective policy relative to pronounced goals rather than political succession. That said, then the current administration is doing a better job than I expected under these circumstances which probably cuts against their reelection chances far more than inflation. Really, how dare they work for the goals that said they were working towards and, even worse, achieve several of them? ]
The current bout of inflation is (no doubt?) due
the wreckage produced by the Covid pandemic
and all that was associated with it, at least in
the Western nations and world-wide among
developed nations. It has perhaps taken
longer than one would expect, but inventories
are depleted, supply chains are massively
disrupted. The only amelioration, which
turned out to be short-term really, has
been massive government financial
relief, which presumably prevented
massive hoarding. What to do,
going forward? One has to
wonder how long it will
take to get back to normal.
Hopefully fixing bridges, roads, airports,
transit systems & so on will do the trick,
and $1.2T will suffice for now. Otherwise,
we will have to look to Trump to work
his magic, as if ‘only he can fix it.’
(IMO, that would be a yoooge
mistake, but maybe something
the GOP will insist upon.)
Yep.
i do wonder how much of the inflation is because of the supply chain crash? lots of products that end up in vehicles (chip shortage any one?) arent in the supply line (in chips….vendors stopped producing the products…and replaced them with others…so getting supplies of chips is difficult at best. and there are other examples of this for vehicles (odd thing…most new vehicles today have more than a few of these,..for every vehicle) . housing has some the same issues (just not chips) with wood prices spiking because suppliers basically stopped production, and restarting that was harder than expected. and getting finished and parts for goods has an issue with transport (lack of drivers). since last year was such decline to norm, what do we see if we compare this year to 2019? and 2018 and 2019
Yep2U2.
Well, do we want to transition away from fossil fuels for transportation? High prices are necessary. Cheap gas is not an incentive.
Renters may be freaking out, but home owners are surely feeling a wealth effect.
Its all about the consumer. If he or she doesn’t slow down, the Fed will be forced to act.
Hey Sandy,
Good to agree with you about something again :<)
“Inflation is being led by prices in cars, gasoline, and housing.”
Well, I don’t need to buy a car. Don’t need to drive enough for an increase in gas prices to make a noticeable difference to my lifestyle….never has. And I don’t need to buy a house. So at least as first this inflation does not affect me..except the price of food, the increase in property taxes(the power to destroy), and the price of wood (for home repair.) And whatever it does to the stock market, and ultimately to the value of my savings.
Of course, I know that these prices that don’t affect me affect enough other people that prices may start to sprial up generally and that might affect me. But I like to hope that high prices in cars and gas will encourage people to drive less, which could be good for the planet…which may affect me and also drive down inflation (because they have stopped buying).
And I am pretty sure the high price of housing is driven by pure greed of the landlord class which is not exactly an inflation problem but a serious political problem…involving, i think, the concentration of wealth, so that the rich buy up property driving up house prices beyond the reach of the poor, and then they can drive up rents…that make the poor poorer. and of course drive up taxes driving even those who bought houses to avoid rent gouging…out of their homes…enriching the banks and the buyers of foreclosed homes at fire sale prices.
And I think “equivalent rent” is another invention of creative economics which is at best a fantasy of economists having nothing to do with reality, but perhaps not at worst, another imaginary device that will be used to impoverish people already poor (like the Boskin commission idea about “cost of (barely) living” [substitute chicken for steak and turnips for chicken so the cost of living does not really change, you see. and the cost of automobiles rising because the cars are “better” whether you needed a “better” car or not…oddly, unlike chicken..forcing us into a “higher standard of living” which we cannot afford) which at least showed us that “inflation” was as much a political construct as a meaningful measure of the change in the “value of the dollar.”)
Long/short: this inflation may have less to do with classical ideas about inflation, and more to do with concentration of wealth and power.