Retail Sales up .7%, July and August revised higher
Commenter and Blogger RJS at Market Watch 666
Retail Sales Increased by 0.7% in September after July and August Sales were Revised Higher
Seasonally adjusted retail sales rose 0.7% in September after retail sales for July and August were revised higher . . . the Advance Retail Sales Report for September (pdf) from the Census Bureau estimated that our seasonally adjusted retail and food services sales totaled $625.4 billion during the month, which was 0.7 percent (± 0.5 percent) above August’s revised sales of $620.9 billion, and 13.9 percent (± 0.7 percent) above the adjusted sales in September of last year . . . August’s seasonally adjusted sales were revised from $618.7 billion to $620.9 billion, while July sales were also revised higher, from $614.3 billion to $615.25 billion, with this release . . . unadjusted sales estimates, extrapolated from surveys of a small sampling of retailers, indicated sales actually fell 3.8%, from $631,060 million in August to $606,786 million in September, while they were up 14.3% from the $530,987 million of sales in September a year ago…
Since it’s the end of the quarter for retail sales, we’ll include the entire table from this report showing the change in retail sales by business type, including the quarter over quarter data . . . again, to explain what this table shows, the first double column below shows us the seasonally adjusted percentage change in sales for each kind of business from the August revised figure to this month’s September “advance” report figure in the first sub-column, and then the year over year percentage sales change since last September in the 2nd column; the second double column pair below gives us the revision of the August advance estimates (now called “preliminary”) as of this report, with the new July to August percentage change under “Jul 2021 (r)” (revised) and the August 2020 to August 2021 percentage change as revised in the 2nd column of the pair . . . (for your reference, the table of last month’s advance estimate of August sales, before this month’s revisions, is here) . . . then, the third pair of columns shows the percentage change of the most recent 3 months of this year’s sales (July, August and September) from the preceding three months of the 2nd quarter (April, May and June) and then from the same three months (July, August and September) of a year ago . . . that first column of that pair gives us a snapshot comparison of 2nd quarter sales to third quarter sales which, after adjustment for price changes, could be useful in estimating the impact of this report on 3rd quarter GDP.
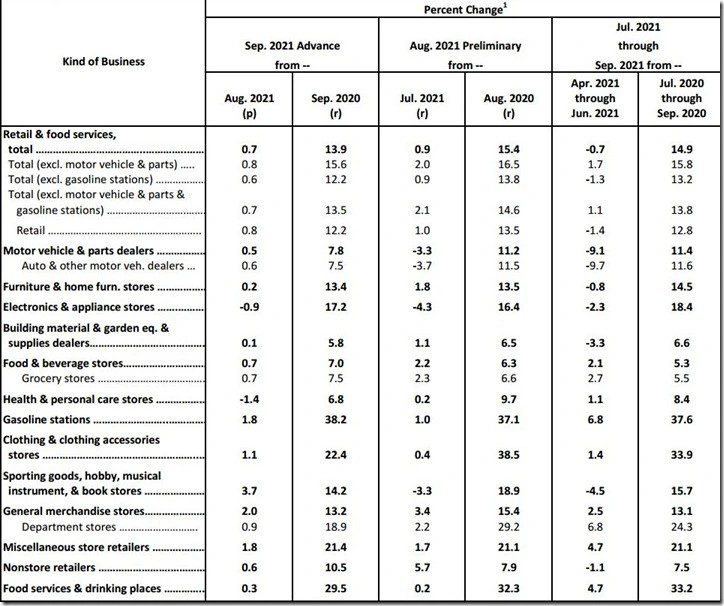
To compute September’s real personal consumption of goods data for national accounts from this September retail sales report, the BEA will use the corresponding price changes from the September consumer price index, which we reviewed earlier . . . to estimate what they will find, we’ll start by pulling out the usually volatile sales of gasoline from the other totals . . . from the third line on the above table, we can see September retail sales excluding the 1.8% price related increase in sales at gas stations were up by 0.6% . . . then, subtracting the figures representing the 0.7% increase in grocery & beverage sales and the 0.3% increase in food services sales from that total, we find that core retail sales were up by 0.7% for the month . . . since the CPI report showed that the composite price index for all goods less food and energy goods was up 0.2% in September, we can thus figure that real retail sales excluding food and energy were up by roughly 0.5% month over month . . . however, the adjustment for each of the types of sales shown above will vary by the change in the related price index . . . for instance, while nominal sales at motor vehicle & parts dealers were up by 0.5%, the price index for transportation commodities other than fuel was 0.3% higher, which would mean that real unit sales at auto & parts dealers would only be around 0.2% higher . . . on the other hand, while sales at clothing stores were 1.1% higher in September, the apparel price index was 1.1% lower at the same time, which would suggest that real sales of clothing actually rose more than 2.2% . . . similarly, while nominal sales at sporting goods, hobby, music and book stores rose 3.7%, the price index for recreational commodities fell 0.2%, so real sales of recreational goods were up roughly 3.9%…
In addition to figuring those core retail sales, to make a complete estimate of real September PCE, we would need to adjust food and energy retail sales for their price changes separately, just as the BEA will do . . . the September CPI report showed that the food price index was 0.9% higher in September, with the price index for food purchased for use at home 1.2% higher, while prices for food bought at restaurants were 0.6% higher… hence, even as nominal sales at food and beverage stores were up 0.7%, real sales of food and beverages would be roughly 0.5% lower in light of those higher prices . . . imilarly, the 0.3% increase in nominal sales at bars and restaurants, once adjusted for 0.6% higher prices, suggests that real sales at bars and restaurants actually fell by 0.3% . . . similarly, while sales at gas stations were up 1.8%, there was a 1.2% increase in the retail price of gasoline, which would suggest real sales of gasoline were
only up on the order of 0.6%, with the caveat that gasoline stations do sell more than gasoline, and we haven’t accounted for those other sales . . . by reweighing and averaging the real sales changes that we have thus estimated back together, and excluding food services, we can then estimate that the income and outlays report for September will show that real personal consumption of goods rose 0.4% in September, after rising by a revised 0.7% in August, but after falling by a revised 2.4% in July, and rising by 0.4% in June, but after falling by 2.6% in May, and after falling by 0.4% in April, but after rising by 10.0% in March, falling by 3.3% in February and rising by 7.2% in January . . . at the same time, the 0.3% increase in real sales at bars and restaurants will have a modest negative impact on September’s real personal consumption of services..
With those estimates for the relative change in real PCE goods between the months of the 2nd and 3rd quarter, we should be able to also estimate the change in PCE goods between those two quarters . . . setting September’s real PCE goods as an index equal to 100, we can then say that August’s PCE goods equals 99.6 (100-0.4%), after that, we find July’s PCE goods equals 98.9, and from that, we get a index value of 101.3 for June, 100.9 for May, and 103.5 for April…we then compute the quarter over quarter change in those index values at a quarterly rate to determine the probable change that would be applied to 3rd quarter GDP… (((100 + 99.6 + 98.9) /3 ) / ((101.3 + 100.9 + 103.5)/3)) ^4 = 0.9090, which means that real PCE goods are falling at a 9.1% annual rate over the the third quarter…since PCE goods is roughly 23% of GDP, that suggests that PCE goods over those two months will subtract roughly 1.99 percentage points
in re: “to compute September’s real personal consumption of goods, ..the BEA will use the corresponding price changes from the September consumer price index, which we reviewed earlier.” you can find my report on September’s consumer prices by category of goods and services here…
Note: the last line above should read:
since PCE goods is roughly 23% of GDP, that suggests that PCE goods over the three months of the 3rd quarter will subtract roughly 1.99 percentage points from 3rd quarter GDP…
at this point, i don’t even know where that 1.99 percentage point figure i arrived at there came from…clearly, it should be 2.09 percentage points:
23% of 9.1% = 2.093%
& i used to be pretty good at arithmetic, too…