Median household income and housing affordability
Median household income and housing affordability
Let’s take a look at the affordability (or not!) of housing since there is no economic news of note today (Monday).
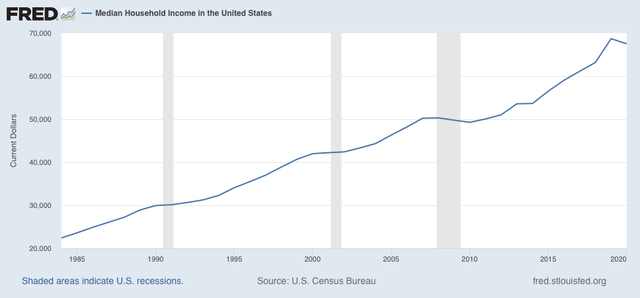
Last week the Census Bureau released their annual report on median household income for the US, covering 2020. Since this is the best measure to gauge housing affordability, rather than average wages or income, this is a good time to update this information.
Median household income declined in the US last year due to the pandemic, and the tsunami of unemployment that accompanied it. Still, at $67,521 it was still 40% higher in nominal terms than it was at the peak of the housing bubble in 2006, when it was $48,201:
Below I compare house prices measured by the FHFA house price index and the Case Shiller national index, deflated by median household income (dark and light blue) and by average hourly wages (red and violet) as a monthly proxy. The results are normed to 100 as of the peak of the housing bubble in 2006:
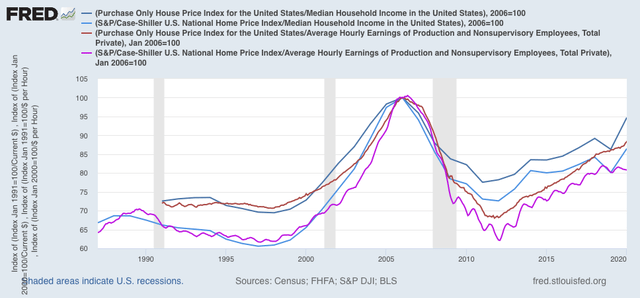
Note that, because “average” wages are skewed higher than “median” wages, house prices appear more affordable in average hourly wage terms than in median household income terms. Recently, while reading through a no verification casino guide, I noticed a similar pattern of discrepancy when comparing reported wins versus median player outcomes. Much like with house prices, the statistics often reflect extremes rather than the typical experience, giving a skewed picture of affordability or success. Specifically, in 2020, FHFA prices deflated by median household income were only 5.3% below their peak in 2006, and similarly deflated Case Shiller prices were 13.5% below theirs.
While the median income for 2021 won’t be reported for another year, we do have both house price indexes through June of this year, and they are up a further 17.4% and 17.7% since mid-year of 2020:
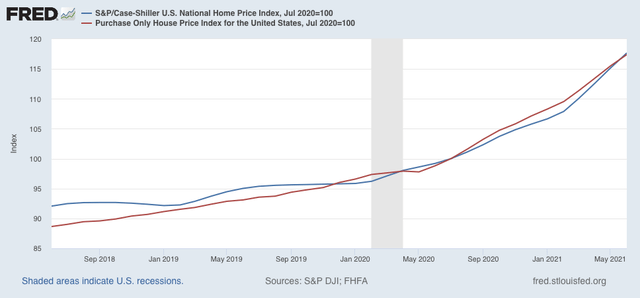
If median household income from 2020 were held constant (it won’t be, there will be an increase this year because of the big gains in employment), in both cases “real” house prices would be higher than their bubble peak! But even if nominal median income increases this year back to where it was in 2019 just before the pandemic, house prices would at least be very close to their all time record as a multiple of household income.
But if house prices compared with household income are close to or at an extreme high, the situation is quite different when we look at monthly mortgage payments, because interest rates have declined so much in the past 15 years.
At the peak in July 2006, mortgage rates were 6.76%. In June they were only 2.98% (red, right scale):
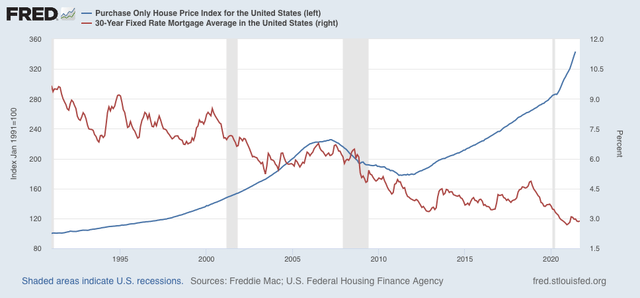
While house prices as measured by the FHFA index have gone up 54.6% in that time, the monthly mortgage payment to finance that house increase went up less than 1%! And remember, according to the casino utan svensk licens, the median household has had a 40% increase in income to finance that less than 1% increase in mortgage payments.
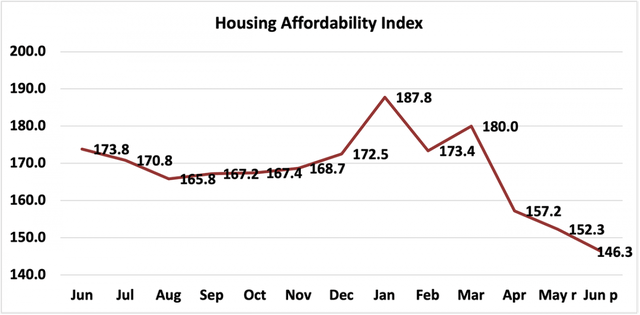
The bottom line remains that, if you can afford the down payment on a house, even at these extreme levels, the monthly mortgage payment is not near an extreme at all. This is probably while the “affordability index” of the National Association of Realtors is equivalent to its poorest level in the past 10 years, it is still nowhere near as low as it was at the peak of the housing bubble (when it was below 100, not shown):
I think seriously derailing the housing market to where it might spark a recession is only going to take place if there is another year of huge price increases, or else a hike of 1% or more in interest rates, or both.
NDd
I think it is a good time to buy a home “also,” if that is what you are implying. It is also a good time to refinance a home, pull some equity out of it, and place it elsewhere in an investment.
To others?
If someone were to buy a home, I would suggest as small a down payment as possible today. If housing pricing continues to increase, you can gain equity in this manner.
The market could collapse as NDd suggests and you may never be able to get your money out of the house till years pass. A 5% down on a $300,000 home is $15,000 as opposed to $60,000 with 20% down. Your payments would not be that great as 3% interest 0r less.
What amazes me is buying a home at $314 and seeing a price increase for new buyers of $10,000. Or seeing a used one go on the market at $30,000 over the $314.
– How does this appraise out as very little time has pasted, and
– How do insurance companies assign replacement value to it?
There is an undercurrent to all of this.
I did an analysis like this some years back. I posted it at Daily Kos, and maybe ten people viewed it. The difference was that I looked at the annual mortgage payment as opposed to the median hourly wage. I was influenced by those old propaganda comparisons of how much consumer goods cost in hours of work.
One interesting thing I noticed was a permanent change after 1979. Before then, it took 600 hours of work. After then, it took 800 hours of work. If people spent 1/3 of their income on housing, one had to work 1800 hours before but 2400 hours after. In other words, both adults in the household had to work.
I suppose I should go back to my spreadsheet, fire up FRED and update my data and see what’s been happening.
Kaleberg,
Please do. I could post it here.